

iDriveSafe is an application designed to receive a driving quality assessment. The driving quality affects the condition of the cargo that is being transported and to some extent the technical condition of the vehicle.
Access rights
To work with the application you should have the following unit access rights:
- Request reports and messages. To receive data.
- Edit not mentioned properties. To save the vehicle type and assessment settings.
If you do not have the Edit not mentioned properties right, all changes are available only during the session. All the changes are lost as soon as you refresh the page.
Interface
There are the following elements in the application interface:
- top panel (in the header),
- statistics table (in the central part),
- work list (to the left of the statistics table),
- switching between tabs (in the footer).
Forming a request
In the top bar, you should indicate the time interval for which you want to receive a driving quality assessment. There are two types of intervals available: established (Yesterday, Today, Week, Month) and adjustable (Custom) for which you can indicate any dates. By using the Previous/Next arrows you can change the established interval for a day, week or month.
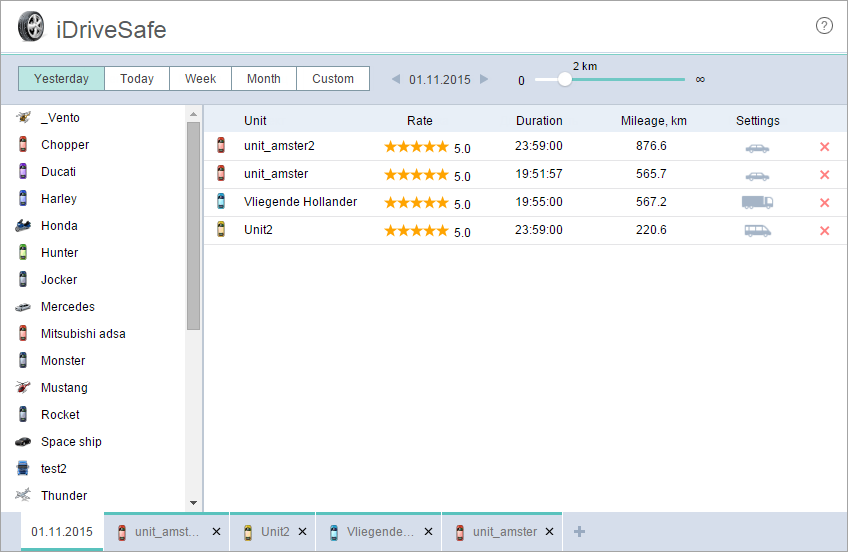
You can indicate the minimum trip mileage in the top bar in order to exclude minor trips.
Select units in the work list by double-clicking. The selected units are added to the statistics table and then the system carries out the calculation. The resulting table includes the following data:
- driving quality assessment,
- trip duration,
- mileage,
- vehicle type,
- assessment strictness.
Assessment criteria
Driving quality is assessed on the basis of three main parameters:
- acceleration rate,
- deceleration rate,
- cornering accuracy.
Depending on a vehicle type and assessment strictness, different ratios of driving evaluation are applied. The ratio differs depending on a vehicle and assessment type. Therefore, you should indicate the corresponding settings for each unit individually.
There are four types of vehicles available:
- Car,
- Van,
- Bus,
- Truck.
There are also three types of assessment strictness:
- Loyal,
- Normal,
- Strict.
Analyzing trips
After carrying out the calculation and receiving the driving quality assessment, you can go to the detailed analysis of the assessment by clicking on the line of the unit in the statistics table. The tab with detailed information has the following interface:
- trips (in the header),
- map (below to the right),
- violations table (to the left of the map).
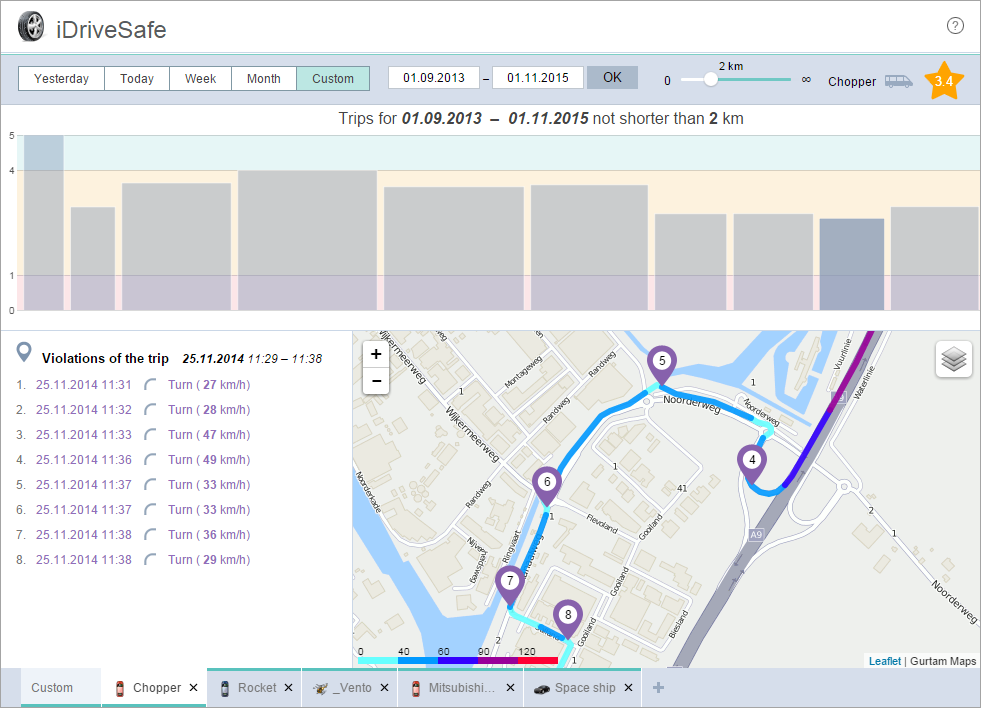
Trips are displayed as columns. The width of the column is the ratio of the duration of the first trip to the time of all the trips in the indicated interval. The height of the column is a driving quality score (with a scale from 0 to 5).
To display a trip track on the map, click on the trip column. Trip tracks are coloured depending on the unit speed. The scale which indicates the speed and the corresponding colour is displayed in the bottom left corner of the map. Violations on the track are highlighted with markers.
The list of violations marked during the trip is displayed on the left of the map. If you click on the marker of the violation on the map, the line with this violation is highlighted on the list.