

Wialon can track trips between geofences if one of them (or several) is set as the starting point, and the other (or several) as the final one. The trips are displayed in a report under the following conditions:
- the unit has left the starting point and has entered the final one;
- according to the detector, there have been trips between the starting and final points.
This report is useful, for instance, to control the transportation of cargo from one place to another in several trips.
Preparing geofences
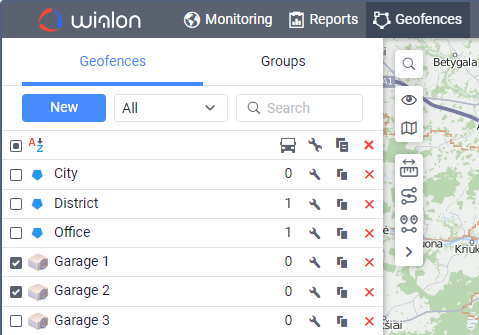
To get a report on trips between geofences, you must first create geofences that determine the beginning and end of the trip. The beginning and the end can be the same geofence if the trip starts and ends in one place, for example, if you need to transport cargo from point A to point B and this will take more than one trip. Create two geofences and then specify them as the starting and ending points in the report template.
Trip parameters
When you create a report template for trips, you can set additional parameters for it.
Allow circle trips
Activate this option if the beginning and end of the trip should be at the same point. In this case, a certain geofence or unit should have both checkboxes selected (the beginning and end of the trip).
Show only the trips finished with a stop
This can be used as an additional filter. If this option is selected, only visiting the geofences with a stop at the final point are considered the end of the trip. Note that a stop is considered to be a unit state in which its speed is less than the minimum moving speed indicated in the trip detector. A trip begins when a unit leaves the starting point. If a unit enters the final destination (after the beginning of the trip has been detected), but does not make a stop there, the trip continues.
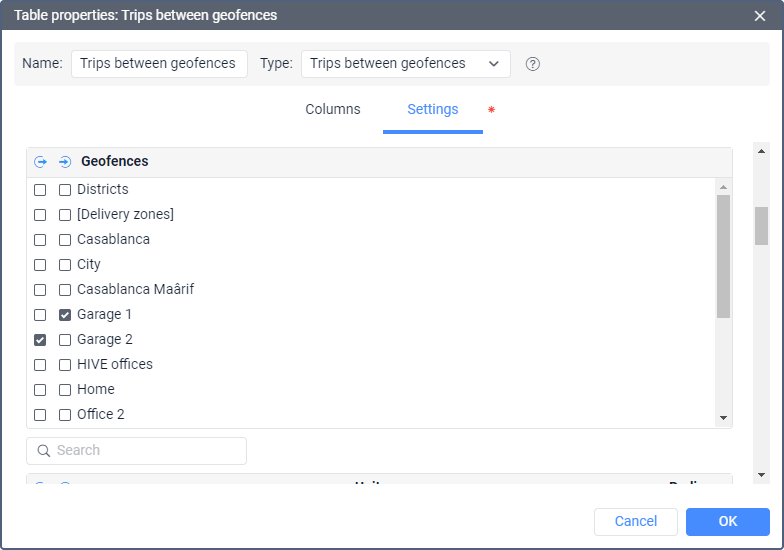
Starting and terminal points
In this section, you choose which geofences and units will be analyzed in the report. You can not only use the geofences from the resource in which the report template is created but also the geofences from other resources to which the user has the View geofences access right. The resource is chosen in the dropdown list above the geofences' names. You can also select the All option for the list to contain the geofences from all the resources to which the user has the necessary access right. The geofences in the list are sorted by name. To quickly find one, use the dynamic filter.
In addition, you can use units as 'moving geofences'. For them, you can additionally set the radius of the unit zone. Both geofences and units are arranged in alphabetical order. To quickly find the required item, use the filter. What is more, the beginning of the trip may be in the unit zone, and the end — in the ordinary geofence. For instance, three cars work in the field and harvest, and one takes the crop to the warehouse.
If a unit simultaneously gets into several geofences (unit zones) specified as starting or terminal points of the trip, the geofence (unit zone) with the smallest area is included in the report.
If the Counter column is selected for the table, you can indicate its mask in the Sensors masks field on the Settings tab. Besides, interval filtration can be applied to this table: by duration, mileage, engine hours, speed range, trips, stops, parkings, sensor state, driver, trailer, fuel drains, fillings, and geofences/units.
The monitoring system provides a possibility of detecting geofence visit in case a trip intersects a geofence by any segment of its track. This option can be enabled in the advanced settings of a report template.
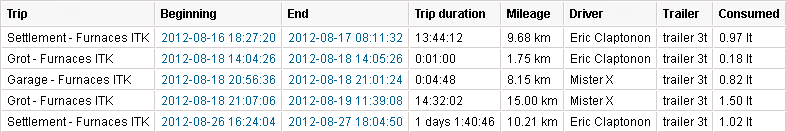
Report on trips
The report on trips gives the list of all performed trips. The table can contain the information described below.
| Column | Description |
|---|---|
| Trip | This column specifies the start and end point of movement (names of geofences or units are hyphenated). |
| Trip from | The departure geofence. |
| Trip to | The destination geofence. |
| Beginning | The date and time when the trip began. |
| End | The date and time when the trip ended. |
| Mileage | The distance travelled during the trip. |
| Mileage (adjusted) | The mileage subject to the coefficient set in unit properties (Advanced tab). |
| Trip duration | The duration of travelling from one geofence to another. It can include parking intervals. |
| Total time | The time from the beginning to the end of trip. It is recommended to use this column in combination with the grouping parameter or the Total row. If the Total row is configured in the table, it shows all the time that elapsed from the start of the first trip to the end of the last one. |
| Parkings duration | The total duration of parking intervals while travelling from one geofence to another. |
| Avg speed | The average speed calculated for the trip. |
| Max speed | The maximum speed registered during the trip. |
| Driver | The name of the driver (if identified). |
| Trailer | The name of the trailer (if it was assigned). |
| Counter | The counter sensor value (can be helpful either in grouping table data by years/months/weeks/days/shifts or for the reports on unit groups). |
| Initial counter | The counter value at the beginning of the trip. |
| Final counter | The counter value at the end of the trip. |
| Avg temperature | The average temperature value registered during a trip. |
| Min temperature | The minimum temperature value registered during a trip. |
| Max temperature | The maximum temperature value registered during a trip. |
| Initial temperature | The temperature value at the beginning of a trip. |
| Final temperature | The temperature value at the end of a trip. |
| Count | The number of trips. |
| Status | The unit status registered during the current trip. It can be registered manually or automatically by means of a notification. If there are several registered statuses, the first of them is displayed. |
| Cargo weight | The average value of cargo weight during the trip. |
| Consumed | The volume of consumed fuel detected by any sort of fuel sensor. If several such sensors are available, their values sum up. |
| Consumed by ImpFCS/AbsFCS/InsFCS/FLS/math/math for FLS/rates | The volume of consumed fuel detected by a fuel sensor (such as impulse/absolute/instant fuel consumption sensor, fuel level sensor) or calculated by math. |
| Avg consumption | The average fuel consumption by any sort of fuel sensor. If several such sensors are available, their values sum up. |
| Avg consumption by ImpFCS/AbsFCS/InsFCS/FLS/math/math for FLS/rates | The average fuel consumption during the trip detected by one of the methods mentioned above. |
| Initial fuel level | The fuel level at the beginning of the trip. |
| Final fuel level | The fuel level at the end of the trip. |
| Max fuel level | The maximum fuel level. |
| Min fuel level | The minimum fuel level. |
| Penalties | The penalties calculated for adjusted Eco driving criteria. |
| Rank | The received penalty points converted into a grade using a 10-point scoring system. |
| Notes | An empty column for your custom comments. |
| Video | Files saved during the trip using the Video module. To watch them, click on the icon The column is available if the Video monitoring service is activated in the account properties. |
| Image | The images received from the unit. Viewing images in reports and the functions available while doing this are described here. |
More information on unfinished trips can be found here.
Questions and answers
Let us suppose that the fuel consumption in the urban cycle is 10 l/100 km and 7 l/100 km — in the suburban cycle.
- Create an ignition sensor (as in the example above) and set 1 l/h for the consumption during idling.
- The average consumption in the urban cycle is 36 km/h, in the suburban — 80 km/h.
- The unit will cover a distance of 100 km driving at a speed of 36 km/h in 2.8 hours. 10 l / 2.8 = 3.57. Let us calculate the value of the increasing coefficient when moving in the city: 3.57 / 1 (idling) = 3.57.
- As a result of a similar calculation for the suburban cycle, we obtain the coefficient equal to 5.6.
- Create an engine efficiency sensor, taking into account the fact that the unit cannot consume less fuel than during the idling, and that it is stationary before the beginning of the movement. As a parameter we use the average speed (speed + # speed) / const2 and fill in the calculation table (manually or using the calculation table wizard):
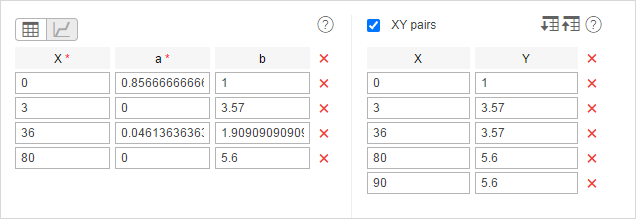
Note that the last pair of points is how the system calculated before (the fuel consumption was considered constant for a speed above 80 km/h). You cannot use this method and change the set of points. Also '3' in this example is the minimum speed from the unit's trip detector, consequently, this parameter can be different for your unit.
Result: in our example, the average consumption has been calculated for the unit. It has been calculated relative to the speed and time between messages and taking into account the values of the vehicle operation.