In this section, you can select the markers that should be displayed on the map, enable their numbering, and configure filtration for the markers shown on the map and in charts.
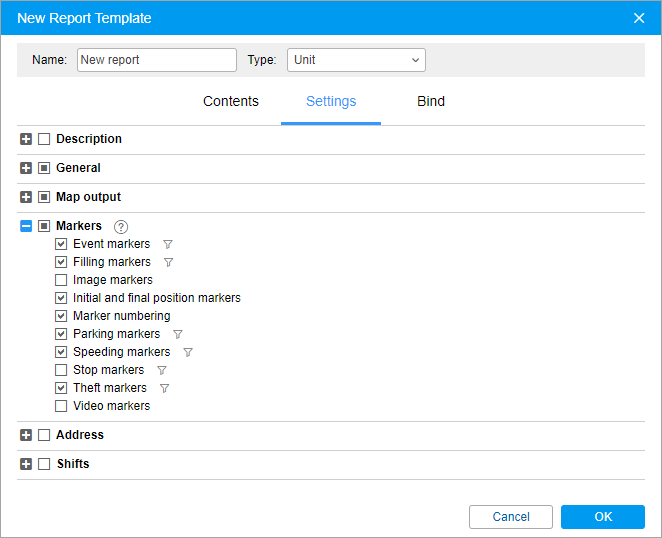
The table below shows all the available markers.
| Marker | Name | Description |
|---|---|---|
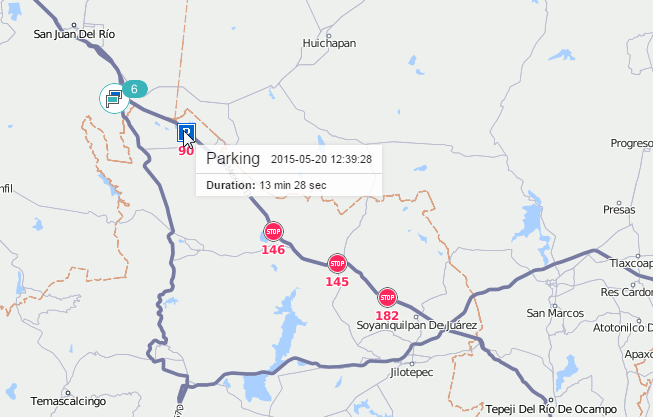
| Parking marker | Marks a location where, according to the trip detector, a parking took place. The tooltip displays the beginning of a parking time and parking duration. |
| Stop marker | Marks a location where, according to the trip detector, a stop took place. The tooltip displays the beginning of a stop time and stop duration. |
| Filling marker | Marks a location where, according to the sensor data, a fuel filling took place. The tooltip displays the time of the filling, the name of the sensor according to which it was detected, and the filling volume. If several fuel level sensors are configured for a unit, a separate filling marker corresponds to each of them. Such a marker shows the sequence number of the sensor among the other fuel level sensors on the Sensors tab of the unit properties. |
| Theft marker | Marks a location where, according to the sensor data, a fuel theft took place. The tooltip displays the time of the theft, the name of the sensor according to which it was detected, and the theft volume. If several fuel level sensors are configured for a unit, a separate theft marker corresponds to each of them. Such a marker shows the sequence number of the sensor among the other fuel level sensors on the Sensors tab of the unit properties. |
| Event marker | Marks locations where events were automatically registered by means of notifications. The events registered manually, including fuel fillings, are also shown by such markers if a location (and preferably a description) is indicated during event registration. The tooltip displays the event time and the text of the event. |
| Violation marker | If you select event markers, then both event and violation markers are displayed because a violation is a special case of an event. |
| Speeding marker | Marks a location where speed limits indicated in the unit properties were violated. The tooltip displays the initial time of the speeding interval (i.e. the time of receiving the first message with a speed value exceeding the allowed one), the allowed speed (indicated in the unit properties), the value of speeding and the total duration of a speeding interval. |
| Image marker | Marks a location where pictures were received from the unit. |
| Video marker | Marks a location where videos were received from the unit. |
| Initial position marker | Marks the initial position of a trip according to the trip detector. The tooltip displays the address. |
| Final position marker | Marks the final position of a trip according to the trip detector. The tooltip displays the address. |


You can configure filtration (icon ![]() ) for filling, theft, stop, parking, speeding, and event markers. The filtration parameters configured in this section are applied to the markers on the map and in charts.
) for filling, theft, stop, parking, speeding, and event markers. The filtration parameters configured in this section are applied to the markers on the map and in charts.
If necessary, you can enable marker numbering.
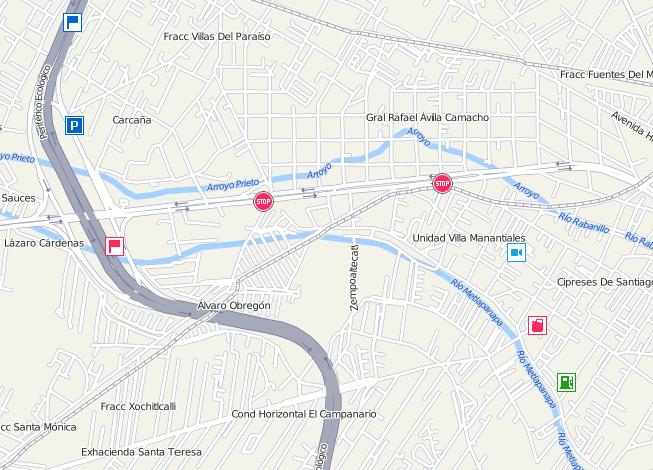
Markers on the map
The selected markers are displayed on the map after executing the report. To see all the available markers, zoom in.
If there are no GPS coordinates in the messages received during an event, then the marker of this event is not shown on the map. For example, the marker of parking is not shown on the map if no messages with the coordinates of the unit were received during it.
When you point to a marker, you see additional information in a tooltip: starting time and duration for stops and parkings, time and notification text for events and violations, time and fuel volume for fillings and thefts, for speedings — starting time, speed limitation as it is defined in unit properties, how much the speed is exceeded, and duration of this speeding.
The panoramic images of the territory can be displayed when clicking on the markers of parkings and stops. For this, maps with panoramas (for instance, Yandex Panorama or Google Street View) should be selected in the user settings. If there are pictures of the territory with the coordinates of the marker, when pointed at it, the cursor changes from arrow to hand. Click on the marker to open a panorama snapshot in the window of the Address tool. Double-click on another such marker to update the information.
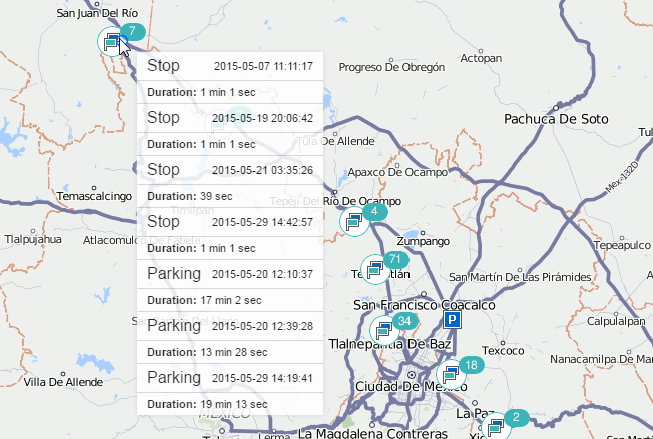
Markers, as well as geofences, can be grouped in case they overlap each other. To enable grouping, activate the Group icons option in the report template. If there are 1000 or more markers, their grouping is enabled automatically. The group icon shows the number of grouped elements. In the icon tooltip, you can see detailed information about the events.
If more than 100 markers are grouped, the tooltip contains only their names without detailed information.
You can enable the Marker numbering option in a report template. In this case, each marker has its sequence number which is indicated below the marker in red color. Numbers are assigned chronologically, and each marker type has its own enumeration.