

The main objective of this report is to facilitate the work with the parameters from the messages. That is why the parameter values are presented not as a single data array but have a particular structure. It means that every parameter is located in its own column.
Along with the parameter values, this report can include other columns described below.
| Column | Description |
|---|---|
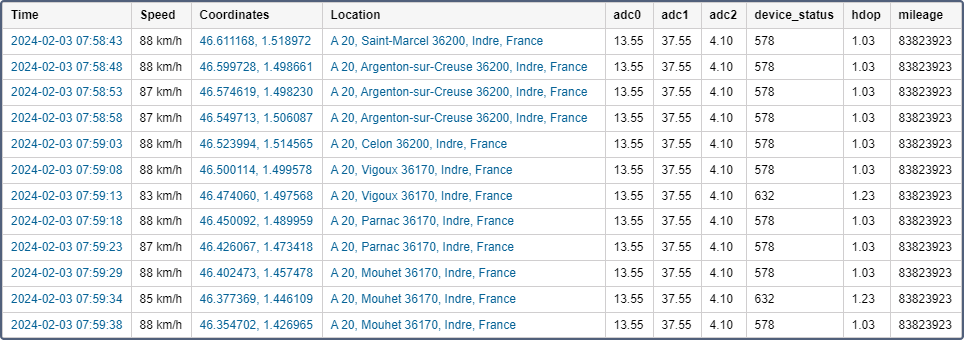
| Time | The date and time when the message was sent. |
| Speed | The speed of a unit from the received message. |
| Coordinates | The coordinates of the unit. |
| Location | The location of the unit at the time when the message was sent. |
| Value | The value of the parameter sent in a message. If the parameter value contains the characters that the system can't decode, then If the numerical value of the parameter sent by the sensor exceeds 53 bits (9,007,199,254,740,991), the accuracy of displaying this parameter in the interface and reports is reduced starting from the lower bits. However, such values can be processed, for example, by bitwise control or used for sensors with bitwise control. |
| Driver | The name of the driver (if available). |
| Trailer | The name of the trailer (if it was assigned). |
| Notes | An empty column to add your custom comments after printing or exporting the report. |
| Image | The images received from the unit. Viewing images in reports and the functions available while doing this are described here. |
Note that you can click on a link in such columns as Time, Coordinates and Speed to view the position of a unit on the map.
This table cannot be generated for unit groups.
Questions and answers