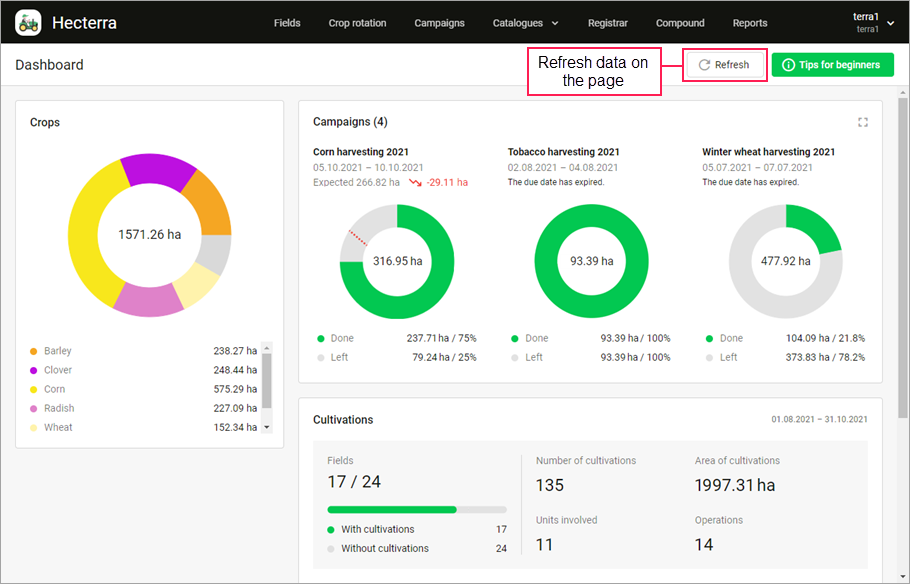
To go to this page, click on the Hecterra logo in the upper-right corner or select the Dashboard item in the user menu.
The Dashboard page presents the collection of data that allows you to assess the general situation in the fields and draw attention to the days with unregistered cultivations. Here you can also find Tips for beginners which explain how to start work in Hecterra.
The information on the Dashboard page is presented in the form of sections: Crops, Campaigns (if added), and Cultivations. The Cultivations section consists of two parts: Summary information and Calendar of cultivations.
The Refresh button updates the data on the page. It is convenient if several users make changes in the same resource from different computers.
Crops
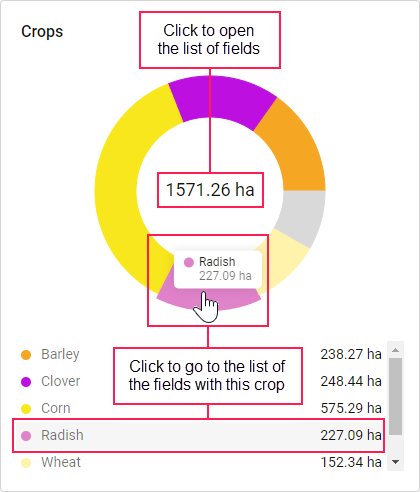
This section includes a pie chart with the information about the total area of fields and crops grown in them. The legend of the chart explains which colour corresponds to which crop and shows the total area of the fields where these crops grow. The same information is available if you point to the coloured parts of the chart.
By clicking on a sector with a crop in the chart or on a line in the legend, you can go to the Fields page where the list of fields will be filtered by the selected crop. If you click on the centre of the chart, all fields are displayed in the list.
Campaigns
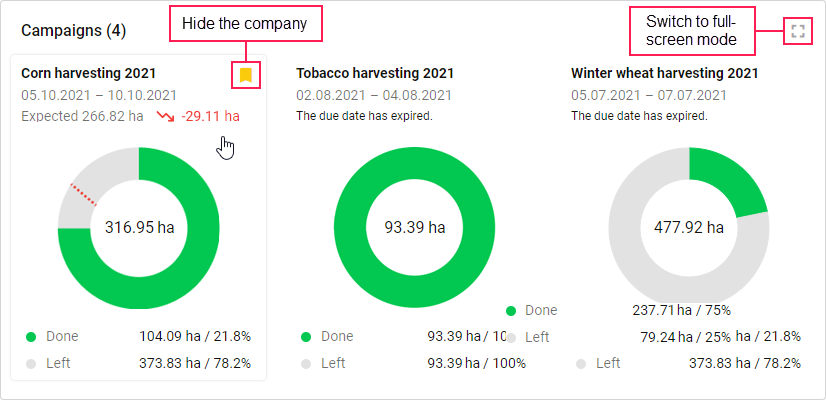
The Campaigns section is available if you have created campaigns and selected them in the list of the Campaigns page using the icon . The information from the section corresponds to the information in the general chart of the Progress tab. You can go to this tab by clicking on a campaign.
If all the selected campaigns don't fit in the section, you can switch it to full screen by clicking on the icon .
To remove a campaign from the section, point to it and click on the icon .
Cultivations
This section consists of two parts: Summary information and Calendar of cultivations.
Summary information
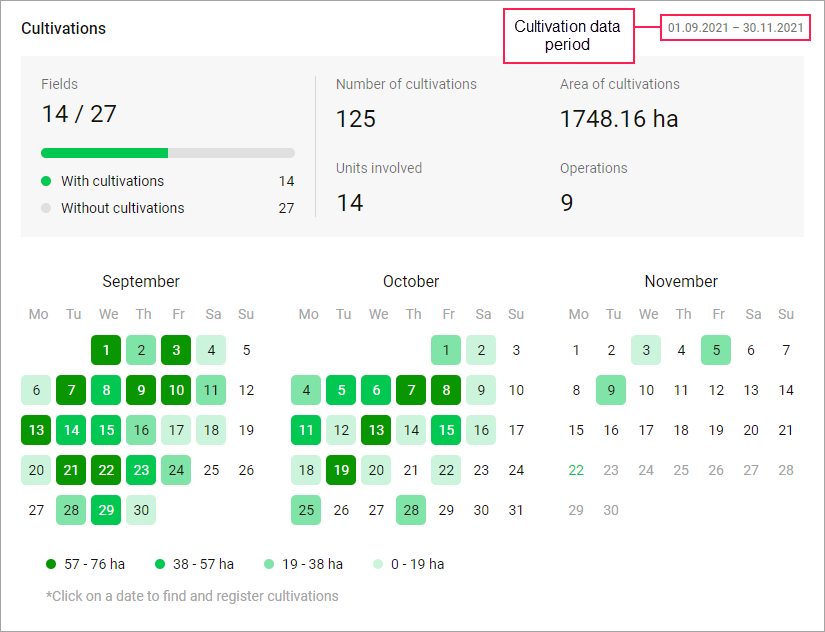
In this section, you can find general information for the period indicated in the upper right corner (the current and two previous months).
| Parameter | Description |
|---|---|
| Fields | The ratio of the number of cultivated fields to their total number. |
| Number of cultivations | The total number of registered cultivations. |
| Units involved | The total number of units used in cultivations. |
| Area of cultivations | The total area where the work was carried out. |
| Operations | The total number of operations performed in the fields. You can view their list in the tooltip. |
Calendar of cultivations
The calendar shows the information about registered cultivations for three months: the current and two previous ones. The days for which the cultivations are registered are highlighted in green: the more saturated the colour, the larger the cultivated area. In the tooltip for the days when there were cultivations, you can see the following information:
- the number of registered cultivations;
- cultivated area;
- the number of units used;
- crops grown;
- operations performed.
After clicking on the date, you are taken to the Registrar page where you can search and register cultivations.


