Campaign Progress
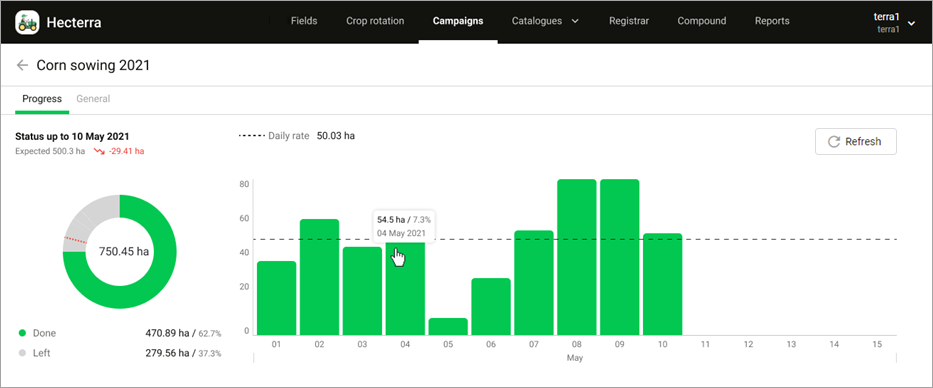
The progress of the campaign is shown in two charts: one is general (the pie chart) and the other is daily (the bar chart). In order for the chart data to be updated, you should regularly register cultivations for the fields related to the campaign. To see the charts, click on the row with the campaign in the list and go to the Progress tab.
General chart
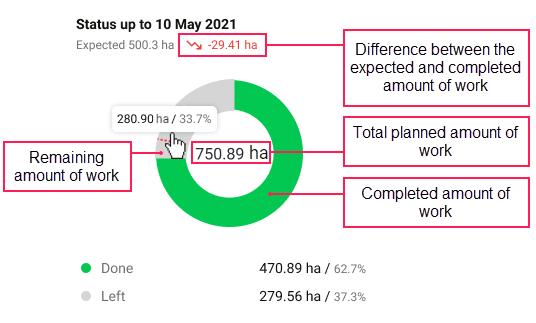
Depending on the campaign progress, the following information can be displayed for the general chart:
| Mark | Description |
|---|---|
| The Expected row, the dotted line in the pie chart | The area expected to have been cultivated by today. It is calculated by multiplying the daily rate by the number of days the campaign has lasted so far. |
| The difference between the expected and actual cultivated area. The plan is being fulfilled. |
| The difference between the expected and actual cultivated area. The plan is not being fulfilled. |
| Number in the centre of the pie chart | The total area of the fields which should be cultivated during the campaign. |
| Green colour in the pie chart | The actual cultivated area. If you register a compound cultivation during the campaign, the system takes into account its total area, and not the areas of the separate cultivations included in it. |
| Grey colour in the pie chart | The remaining area to be cultivated. |
Some of this information is also shown in the tooltips of the chart elements.
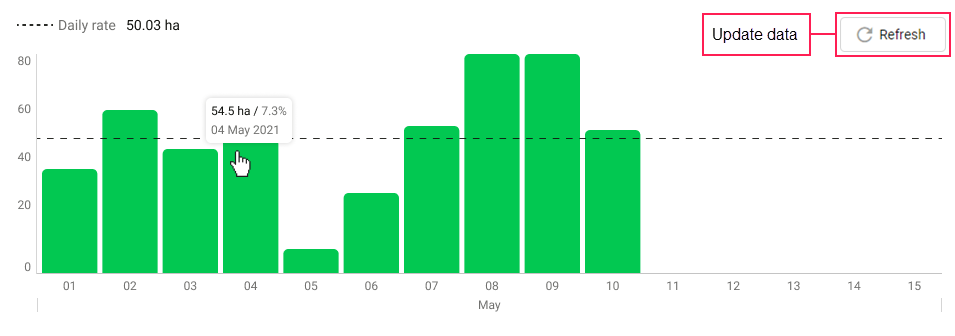
Daily chart
In the daily chart, you can see the actual cultivated area for each day of the campaign. In contrast to the pie chart, here the areas of the separate cultivations belonging to a compound one are included in the actual cultivated area.
The dotted line indicates the daily rate, that is, how much area per day should be cultivated on average in order to complete the campaign on time.
The tooltips of the chart bars show the actual cultivated area, its percentage of the total field area in the campaign, and the cultivation date.
To update data in both charts, click on the Refresh button.