

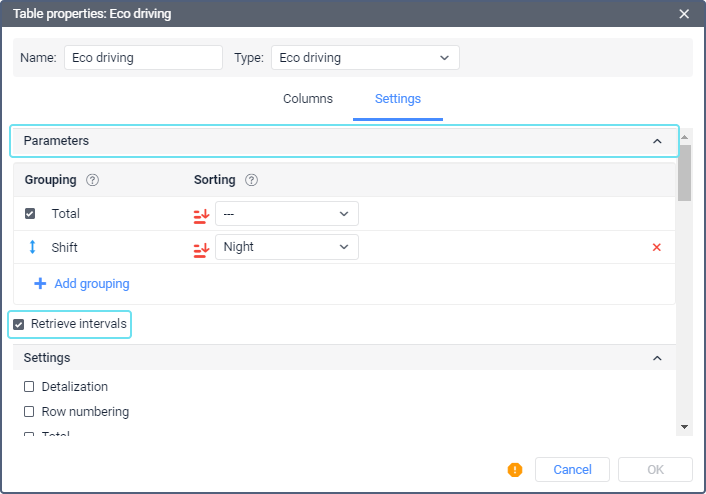
In the Parameters section, you can configure the grouping and sorting of the report data.
Grouping
Grouping is the arrangement of information based on the indicated characteristics.
When adding a new grouping, click Add grouping, select a time interval in the appeared drop-down list and click Add.
From the available time intervals (year, season, month, week, day of the month, day, date, shift, duration), select those based on which you want to group the tabular data. Grouping can be either single- or multi-level. Multi-level grouping implies that there are several groupings for different time intervals. When using it, it is required to assign a hierarchy (specify nesting). For example, the grouping can be as follows: tabular data is grouped by year, within each year by months, and within months by days. Nesting is adjusted by dragging the intervals in the Grouping column up or down, with the elements above in the list containing the ones that are located below.
When grouping by day is used, the intervals which cross the end of one day and the beginning of the next one are not split into several intervals in the report, but belong to the first day.
If grouping by such intervals as season and duration is selected, at the bottom you can find a special block where it is necessary to set values for the intervals.
For seasons
Enter the name of the season, for example, summer, autumn, etc. Afterwards, use the drop-down lists to specify its duration. Note that the duration of the season is a period from the beginning of the first specified month to the end of the last. The minimum duration of the season is one month. Thus, if the Wintry season lasts during February, in both drop-down lists you must select February. To activate the season, click the Add button. The maximum number of seasons is 12.
For duration
For each interval of duration, you must enter a name (for example, interval 1), then specify the duration in seconds, minutes, hours or days (select from the drop-down list), and also activate it by clicking the Add button. The maximum number of duration intervals is 5. Using the Trips report as an example, let us look at how the use of duration intervals influences the presentation of the report data. The following periods are indicated:
- Short trips: up to 15 minutes,
- Medium-term trips: up to 1 hour,
- Long trips: up to 3 hours.
Information in the report will be presented in the following way: short trips — from the minimum trip time indicated in the trip detector up to 15 minutes, medium-term trips — from 15 minutes up to 1 hour, long trips — from 1 up to 3 hours.
Depending on the report type, besides standard groupings (by time intervals), additional groupings can be used as well (for example, by geofence, route, sensor, user, event, action type, violation type, trips, streets). In this case, the grouping works by name.
Sorting
Sorting is the distribution of information in a table in descending or ascending order based on the selected characteristics.
Sorting allows you to distribute the grouped data by any selected column of the report table.
You cannot sort data by custom columns.
Next to each added grouping interval, in the Sorting column, there is a drop-down list where you can specify the column included in the report so that the data will be sorted by the specified characteristic (column) within the grouping. The selected sorting criterion is applied to the subsequent (nested) grouping level. In addition, to the left of the drop-down list, there is an icon with the help of which you can set the direction of sorting (from smaller to greater and vice versa).
Tabular data can be sorted even if the grouping is absent. To do this, in the drop-down list in front of the Total interval select the sorting parameter and also set the direction of grouping.
Example
Let us consider the example of grouping and sorting use.
We create a report on trips. In this report, we are interested in maximum speed, duration, and mileage. Mark these columns. In addition, the information should be grouped by years, months and dates; the dates, in turn, should be sorted by the maximum speed (from high to low).
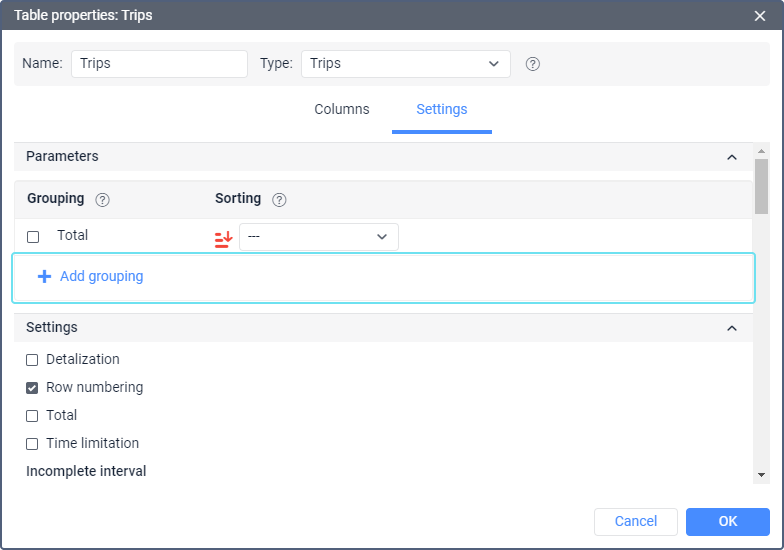
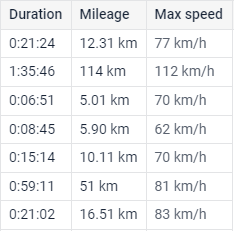
By default, there is no grouping, i.e. without adding grouping or sorting settings, we would get a detailed report where an individual line would correspond to each criterion. These lines would be arranged in chronological order or according to the sorting, indicated next to the Total grouping.

The report table with default settings is shown below.
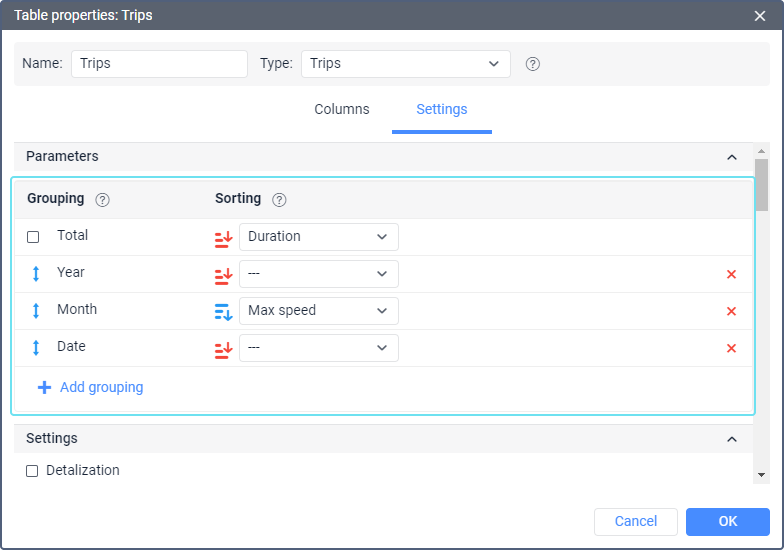
In order to get the result that corresponds to our task, we need to add the Year, Month and Date groupings. If necessary, we can move the grouping criteria to the desired position in the list (we need the Year –> Month –> Date sequence).
Next, we determine the sorting criteria and direction. Since we want to set sorting for the level nested in months (for dates), we select the corresponding criterion from the drop-down list of months. Then click the icon of sorting direction to adjust it from a bigger to a smaller value.
By default, the data is sorted in chronological order.
The report looks as follows:
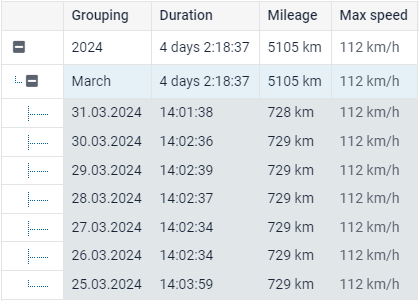
Compared to the table for which the grouping and sorting settings are not specified, this table has two additional columns. The first one is a column containing the + and - buttons, which help show/hide nesting levels. The second is the Grouping column, which shows the levels themselves. The information in the table is grouped by years, and by clicking on the plus the next levels of grouping (months, dates) are opened. The dates are sorted by the maximum speed (from high to low).
Time intervals and their use in reports
Total is the highest level of grouping (cannot be moved). If the option is enabled, the report contains a grouping with the resulting data (the total duration of any state, the total number of registered events, etc.) in which all the subsequent groupings are nested (if there are any). The intervals are described in the table below.
| Interval | Description |
|---|---|
| Year | The grouping of the information in the table by years. |
| Month | The grouping of the information in the table by months. |
| Week | The grouping of the information in the table by weeks. The number of the week is displayed (e.g. week 26, etc.). |
| Day | The grouping of the information in the table by days of the week (e.g. Monday, Tuesday, etc.). |
| Day of the month | The grouping of the information in the table by days of the month (e.g. the 1st, 2nd, etc. day of the month). |
| Date | The grouping of the information in the table by dates. |
| Shift | The grouping of the information in the table by shifts. |
When grouping data, the events that began in the interval are included in it. To determine the duration of an event, its entire duration is taken into account, even if it has already ended in another interval. That is why in the Duration column there may be values exceeding the size of the interval itself.
When grouping the table data, it makes sense to use the Total time column, which, unlike the Duration column, shows not the sum of the intervals (e.g. the total time of all trips), but the time from the beginning of the first interval to the end of the last one. This allows, for instance, to calculate the total time of the working day (convenient for travel sheets).
Retrieve intervals
The Retrieve intervals option in Parameters section is applied only to reports with grouping by shifts. If the option is activated, the report displays only those parts of trips which have overlapped the shifts on the specified interval. If the option is deactivated, the report shows all the trips which have overlapped the shifts at least partially on the specified interval, and these trips are included in the report from beginning to end.
The Retrieve intervals options are also available in the Interval filtering section for some filters.