Several tables and charts can be generated for users.
In the Statistics the following fields are available: report template name, user name, reporting interval (beginning/end), report execution time, total time spent in the system, and logins count.
Log table
A set of columns for this table matches the one used in the same report on units.
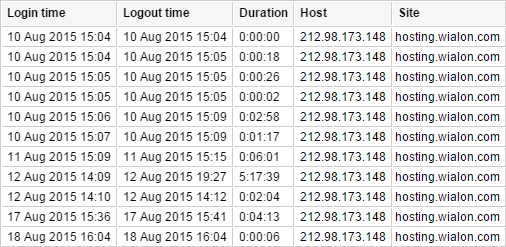
Logins table
This kind of table shows what services the user logged in and how often. The table can contain the following columns.
| Column | Description |
|---|---|
| Login time | The time when the user logged on to one of the services. |
| Logout time | The time when the user exited the service. |
| Duration | The time interval the user was online. |
| Host | The address of the computer from which the user logged in. |
| Site | The name of the service where the user logged in. |
| Count | The number of logins. |
| Notes | The empty column for custom notes. |
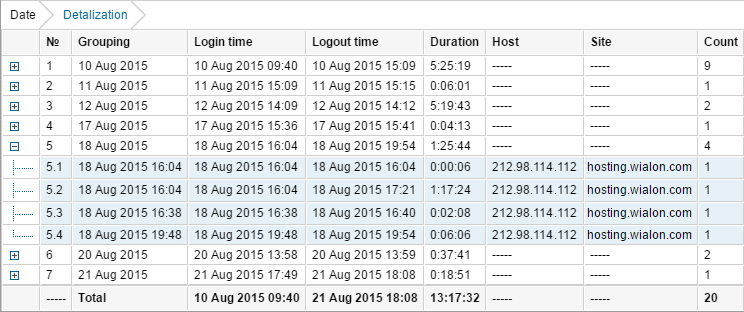
The same settings as for all the other tables can be applied to the user logins table: grouping, detalization, row numbering, total row, and time limitations. In the example below, you can see the user logins table with grouping by days, detalization, numbering, and total row.
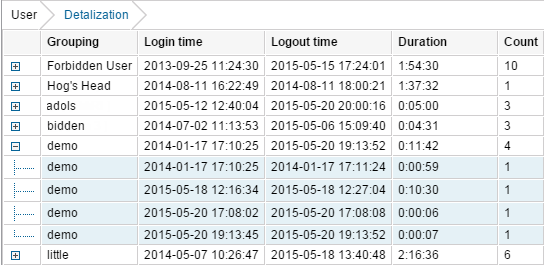
One report can display logins of more than one user. However, in this case, the report type should not be User but Resource. All the users that belong to an account for which such a report is executed, get into the report. See the example:
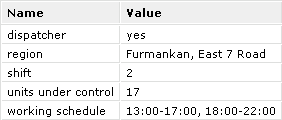
Custom fields table
The Custom fields table represents the list of custom fields entered in the corresponding tab of the user properties dialog. This report has the same characteristics as the same report for units and groups.
Charts applied to users
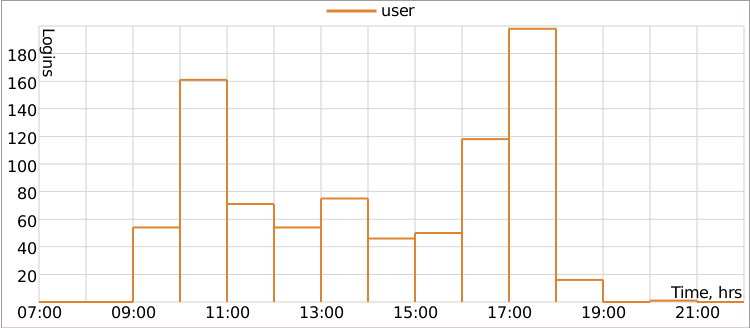
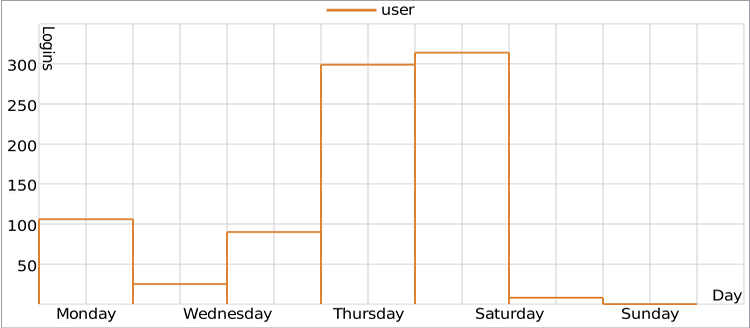
Two kinds of charts can be attached to the report on user logins: Logins/Hours and Logins/Days of the week. To get these charts, click the Add chart button and select the type in the dropdown list of the report template.
The Logins/Hours chart shows the frequency of the user's logons to the system at different times (hours):
The Logins/Days of week chart shows how often the user logged to the system on different days of the week:


