

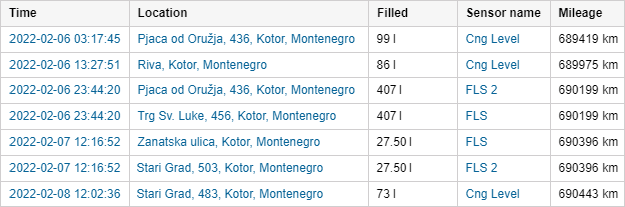
This report shows where and when a vehicle was filled up. The parameters for the report are set in the properties of the fuel level sensor. This report is generated on the basis of fillings registered manually or detected by sensors. The table cannot be generated if no fuel fillings are found for the indicated time interval.
The table can include the columns described below.
| Column | Description |
|---|---|
| Time | The moment of the most significant change in the fuel level. |
| Location | The location of the unit at the time of filling (if a filling is registered manually, the location of the unit is detected on the basis of the messages received at the time of filling registration). |
| Initial fuel level | The fuel level before the filling. |
| Final fuel level | The fuel level after the filling. |
| Filled | The volume of filled fuel (the name of the sensor can be indicated in parenthesis). |
| Registered | The volume of registered fuel. |
| Difference | The difference between the detected and registered filling volume. |
| Description | A brief description indicated during the manual registration of fuel filling. |
| Sensor | The sensor which detected the filling. |
| Driver | The name of the driver (if identified). |
| Trailer | The name of the trailer (if it was assigned). |
| Count | The number of fillings. |
| Counter | The indications of the counter sensor. |
| Mileage | The mileage sensor value at the moment of filling. If the mileage parameter was not saved throughout the reported period, the mileage is counted from 0. |
| Avg value of custom sensor | The average value of the custom sensor registered during the filling. |
| Min value of custom sensor | The minimum value of the custom sensor registered during the filling. |
| Max value of custom sensor | The maximum value of the custom sensor registered during the filling. |
| Initial value of custom sensor | The value of the custom sensor registered before the filling. |
| Final value of custom sensor | The value of the custom sensor registered after the filling. |
| Notes | An empty column for your custom comments. |
| Image | The images received from the unit. Viewing images in reports and the functions available while doing this are described here. |
The interval filtration by geofences/units, drivers, trailers, filling volume, and sensor masks can be additionally applied to this table. Note that in the case of sensor masks, interval filtration is only applied to the fuel filling detected by sensors.
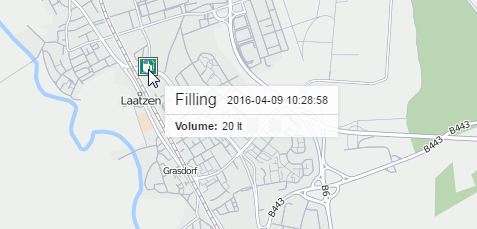
You can use special markers for this report to mark places of fillings on the map.
Information on fuel thefts can be found here.