Data messages are messages sent to the server from the unit device. As a rule, they contain information about the unit speed and location at the time of sending, the message generation time, and other parameters depending on the device type.
When requesting data messages, you should select the way of displaying parameters.
| Option | Result |
|---|---|
| Raw data | All the parameters are displayed in one line in each table column. |
| Sensor values | The value of each sensor is displayed in a separate column according to the calculation table. By default, only the values of visible sensors are displayed. You can manually add columns with the values of other sensors. |
When working with data messages, the following features are available:
- viewing messages in the table;
- analyzing parameters in the chart;
- using the map;
- viewing the statistics.
Table of data messages
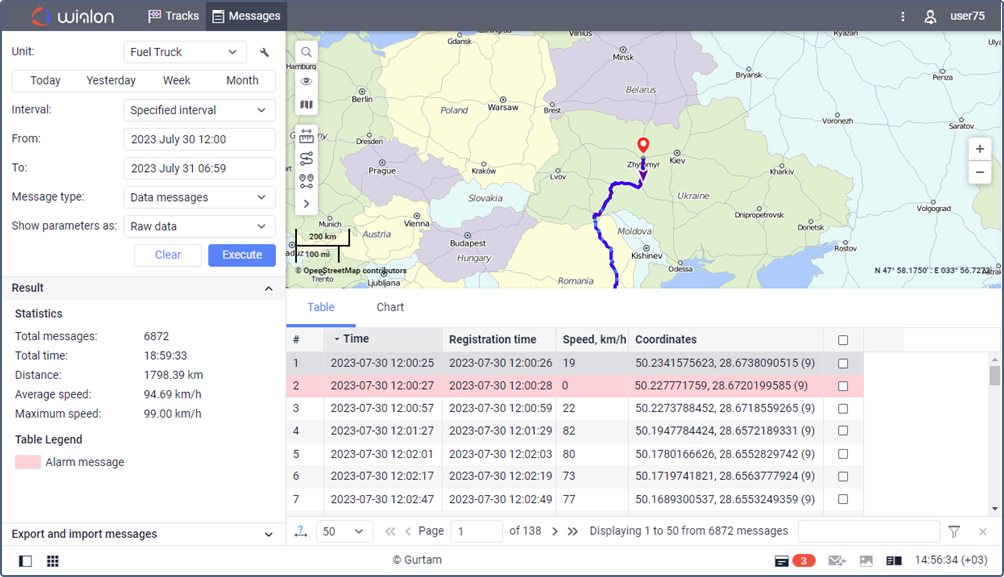
The table of data messages has the following columns:
| Column | Description |
|---|---|
| Time | The date and time when the message was generated by the device. If the message contains the WLNTMNS parameter (time in nanoseconds), its value is regarded as the message generation time and is shown here rounded to seconds. |
| Registration time | The date and time when the message was received on the server (disabled by default). |
| Speed | The speed of movement of the unit according to the message. If the unit location is determined by LBS (see the Allow positioning by cellular base stations option), 0 is shown even if an alternative speed source is indicated. |
| Coordinates | The latitude and longitude of the position of the unit. The number of locked satellites is indicated in parentheses. |
| Altitude | The height above the sea level. If the device cannot transmit height data, a dash is displayed in the column. |
| Location | The address of the unit when sending the message. |
| Parameters (if available) | The values of the parameters of all available sensors. The messages can be filtered by parameters. Sensor parameters can be displayed in separate columns of the table. To do this, you should select the Sensor values option of displaying parameters. |
| Media | In this column, you can open images or videos sent by the unit. To do this, click on the icon . To save an image, open it and click Save as in the lower-left corner of the window. |
| Video | In this column, you can open video files saved as a result of triggering a notification with the Save video as file action. To do this, click on the icon (the number of grouped files is indicated to the right of it, if several). If several grouped files are available, you can select the required one in the drop-down list in the upper-left corner. When watching the video, you can perform the same standard actions as on the Files tab of the video module. |
| Delete | The selection of messages you want to delete. |
The following messages are highlighted in the table:
- : alarm messages (SOS messages from the device or messages with non-zero values of the Alarm trigger sensor);
: black box messages (2 to 10 min);
- : black box messages (10 to 30 min);
- : black box messages (more than 30 min);
- : messages with the location determined by Wi-Fi;
- : messages with the location determined by LBS;
- : imported messages.
The information on each color and the message that corresponds to it is located in the Table legend section.
See more about working with the table and deleting messages here.
Chart of parameters
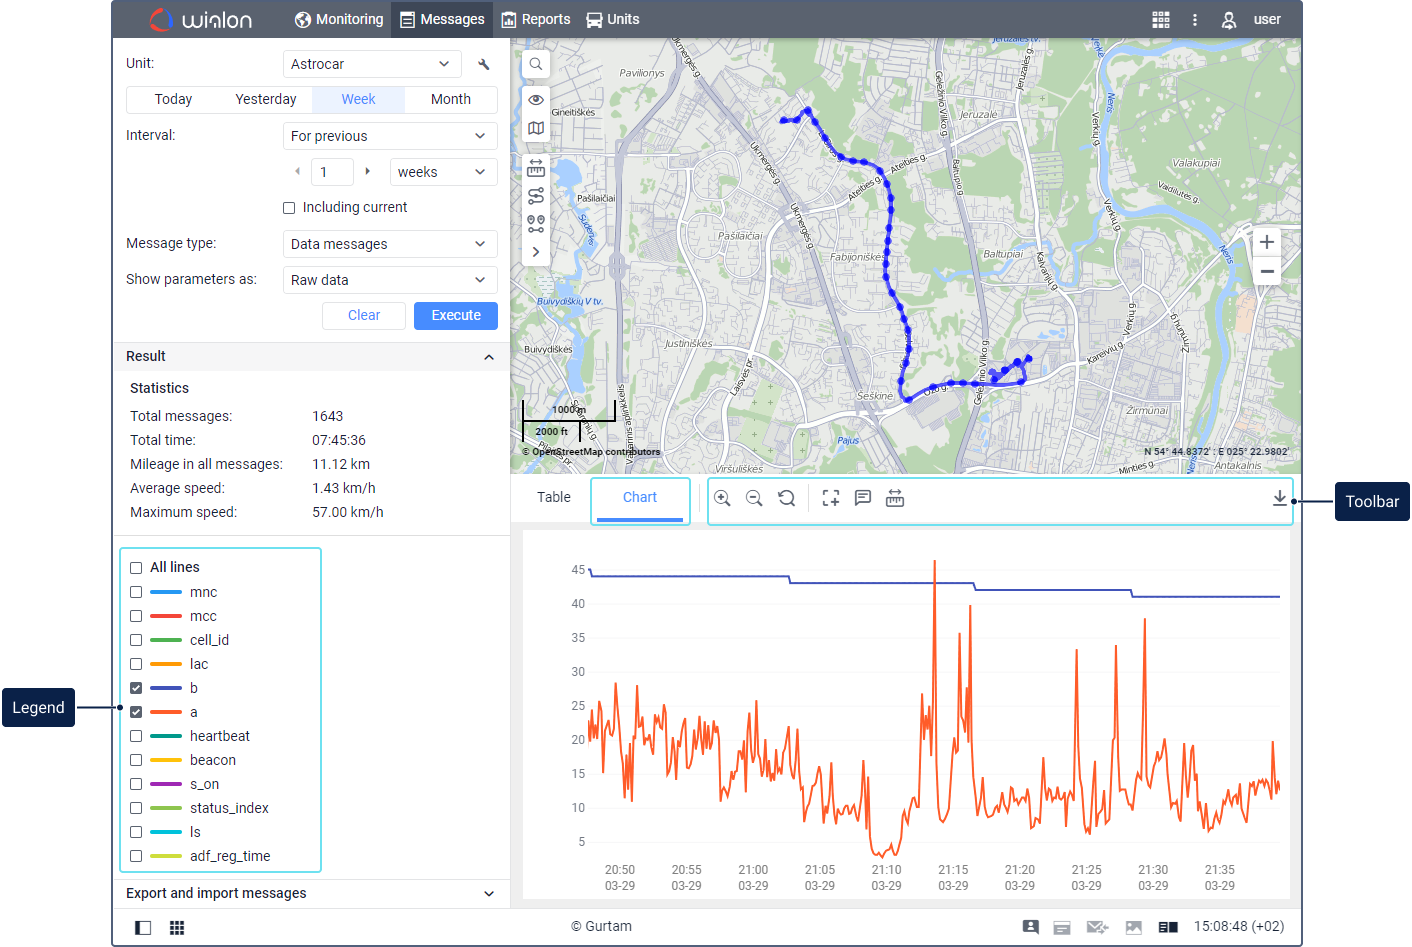
Apart from the table, you can see the result of requesting data messages in the chart. To go to the chart, select the Chart tab above the table.
When working with the chart, its legend is displayed in the work area. Here you can select the lines which should be displayed in the chart. Each line corresponds to a specific parameter and has its own color. The color is selected automatically each time you request the messages. The lines of all the parameters are displayed in the chart by default. To remove a line from the chart, disable it in the legend. For disabling or enabling all the lines, use the All lines checkbox. To see only one line and remove the others, point to it in the legend and click Only this.
When pointing to any place of the chart, you can see a tooltip with basic information about this point: the date, time, and the parameter values received at that moment (or the moment near to that). The tooltip shows the values of all the parameters selected in the legend. If there are too many of them and they don't fit in the tooltip, disable the unnecessary lines in the legend.
When you point to a certain line in the chart, the rest of the lines become lighter, and the name and value of this line is shown in bold in the tooltip. To analyze points in the chart, you can also use the Show detailed information about points tool.
The toolbar above the chart contains the following tools:
Tool | Description |
Zoom in. You can use the mouse scroll wheel instead of this tool. | |
Zoom out. You can use the mouse scroll wheel instead of this tool. | |
Show all the interval. This tool allows you to zoom the chart so that it displays all the selected lines. | |
Select and zoom in on a chart area. To use the tool, click on the icon and select the area you want to zoom in. To exit the selection mode, click on the icon again. This tool is unavailable when using the Compare data tool. | |
| Show detailed information about points. Click on the icon to see tooltips with information from the unit messages when you point to the chart points. If a tooltip contains coordinates, then when you click on them, it is possible to go to the map of a third-party source. See more. This tool is unavailable when using the Compare data tool. |
Compare data. Read about this tool here. | |
Save as PNG. Click on this icon to download a PNG file with the image of the chart. The chart in the image looks the same as on the screen. |
Using the map
After querying messages, the track of the unit is displayed on the map.
Click on a row in the table or on a point in the chart so that the place from which the message has been sent is indicated on the map with the marker .
The track color is blue by default. You can configure the track color by speed or sensor value on the Advanced tab in the unit properties.
When you point to the track, the nearest message is searched. If such a message is found within a radius of 50 pixels, the point of receiving the message is highlighted by a pulsating circle, and detailed information is displayed in the pop-up window: the time when the message was received, address, the speed of the unit at that point, altitude, coordinates, number of satellites, sensor values. When you click on the coordinates, it is possible to go to the map of a third-party source. See more.
When you open other tabs, the map layout and the track lines are saved. To clear the map, you can disable the Messages layer or go back to the same-name tab and press Clear.
Statistics
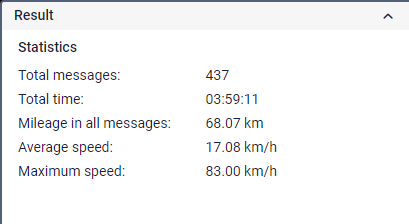
This section provides general information about messages for the selected interval.
The units of measurement (metric or American) for values in statistics depend on the settings specified in the unit properties.
| Row | Description |
|---|---|
| Total messages | The total number of messages from the unit. |
| Total time | The interval between the first and the last message with coordinates from the unit. |
| Mileage in all messages | The mileage travelled by the unit during the specified interval. Calculated in the same way as the Mileage in all messages column in reports. |
| Average speed | The average speed value of the unit. Only the messages with coordinates are taken into account. |
| Maximum speed | The maximum speed value of the unit. |
Questions and answers


