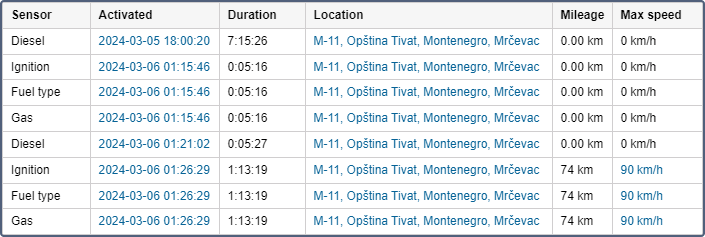
The Digital sensors table contains information about the operation of the digital sensors of a unit.
Usually, digital sensors have two states: on/off, activated/deactivated, and so on. For example, it can be an ignition or cargo load sensor. All sensors are configured in the unit properties.
To receive the information about a specific sensor, specify its name or part of the name using wildcard symbols — an asterisk * (replaces several characters) or question mark ? (replaces one symbol) in the Sensor masks section of the table settings. The sensor name cannot contain commas. If sensor masks are not specified, the information in the table is displayed for all sensors of the unit.
The Digital sensors table can contain the following columns.
| Column | Description |
|---|---|
| Sensor | The name of the controlled sensor. |
| Activated | The time from the first message that contains information about the activation of the sensor. |
| Deactivated | The time when the sensor was deactivated. |
| Duration | The interval when the sensor was on. |
| Total time | The time from the beginning to the end of sensor activation. It is recommended to use this column in combination with the grouping parameter or the Total row. If the Total row is configured in the table, it shows all the time that elapsed from the beginning of the first activation of a sensor to the end of the last one. |
| Location | The location of the unit at the moment the sensor was activated. |
| Final location | The location of the unit at the moment the sensor was deactivated. |
| Mileage | The distance travelled while the sensor was on. |
| Mileage (adjusted) | Mileage subject to the coefficient set in the unit properties (the Advanced tab). |
| Initial mileage | The mileage sensor value at the time the digital sensor is turned on. If the mileage parameter was not saved at the reporting interval, the mileage is counted from zero. |
| Final mileage | The mileage sensor value at the time the digital sensor is turned off. |
| Avg. speed | The average speed of movement with the sensor on. |
| Max. speed | The maximum speed with which the unit moved with the sensor turned on. |
| Activations count | The number of activations (can be helpful either in grouping table data by years/months/weeks/days/shifts or for the reports on unit groups). |
| Driver | The name of the driver (if assigned). |
| Trailer | The name of the trailer (if assigned). |
| Penalties | The penalties calculated for the adjusted Eco driving criteria. |
| Rank | The penalty points converted to the 10-point rating system. |
| Avg. value of custom sensor | The average value of a custom sensor from the moment of a digital sensor's activation to its deactivation. |
| Min. value of custom sensor | The minimum value of a custom sensor from the moment of a digital sensor's activation to its deactivation. |
| Max. value of custom sensor | The maximum value of a custom sensor from the moment of a digital sensor's activation to its deactivation. |
| Initial value of custom sensor | The custom sensor value at the moment of a digital sensor's activation. |
| Final value of custom sensor | The custom sensor value at the moment of a digital sensor's deactivation. |
| Notes | An empty column for your custom comments. |
| Video | Files saved using the Video module during the interval between the activation and deactivation of a digital sensor. To watch them, click on the icon (the number of grouped files is indicated to the right of it, if several). If several grouped files are available, you can select the required one in the drop-down list in the upper-left corner. The column is available if the Video monitoring service is activated in the account properties. |
| Image | The images received from the unit. Viewing images in reports and the functions available while doing this are described here. |
If there are several custom sensors, separate columns with average, minimum, maximum, initial and final values are displayed for each of them. The name of each custom sensor and units of measurement (if they were specified when creating the sensor) are indicated next to the name of each of these columns within the parentheses. In case there are no suitable sensors, the columns are not displayed.
Interval filtration can be applied to the Digital sensors table: by duration, mileage, engine hours sensor, engine hours, speed range, trips, stops, parkings, sensors masks, driver, trailer, fuel fillings, fuel drains, battery charges, and geofences/units.
Questions and answers


