Working with tables
Working with a table consists in:
- interacting with the toolbar;
- going to messages and points on the map;
- false events marks (if available);
- viewing images (if available).

For some tables, it is possible to view track segments corresponding to each message on the map (icon  ). Read more about this and other features related to tracks in reports here.
Toolbar
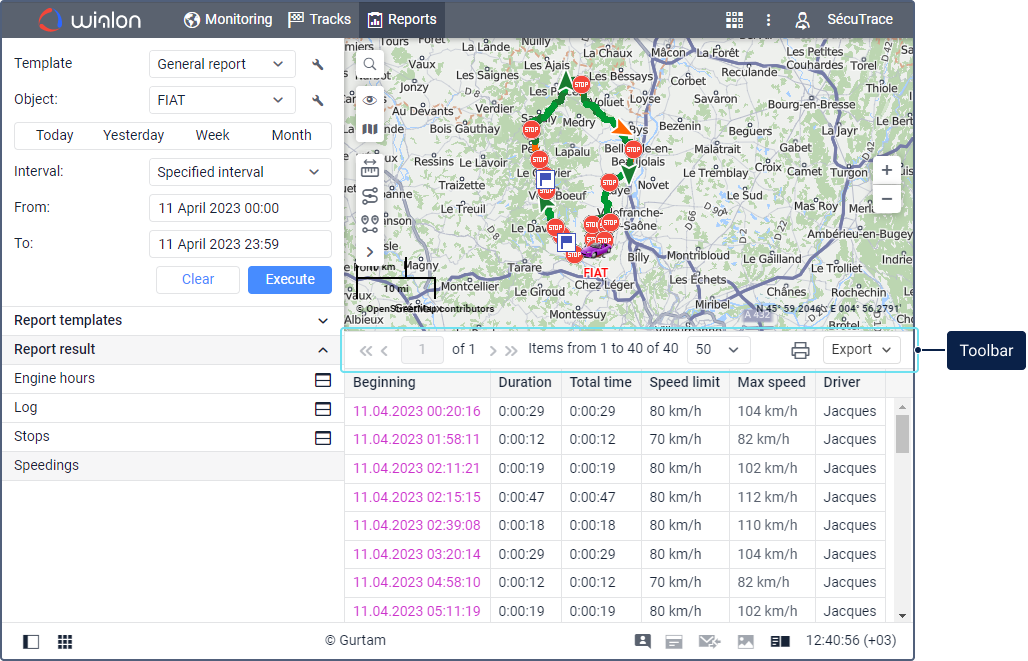
A report table can contain up to 100,000 rows, therefore, it is divided into pages. To navigate between pages, use the navigation buttons on the left side of the toolbar:
 : go to the next page;
 : go to the previous page;
 : go to the first page;
 : go to the last page.
To go to a specific page, enter its number in the Page field and press Enter. You can also adjust the number of rows per page by selecting one of the options (25, 50, 100, 200, 500) from the drop-down list to the right of the navigation buttons.
The following tools are available on the right side of the toolbar:
| Tool | Description |
|---|---|
Print the report. See more information about this feature here. | |
Export the report. To download the report, expand the drop-down list and select the required format. The following formats are available for quick export: XLSX (export of tables and statistics), PDF (export of all the contents). The drop-down list also contains the option of export to file () which allows you to select a different format and/or specify additional settings. | |
Download all images for the report interval. Available if at least one of the report tables contains the Image column. The images are saved to an archive along with information about the date, time and place of their sending. | |
Close the table. Displayed when working with two tables, a table and a chart, or a table and statistics at the same time. |
Going to messages and places on the map
From a report table, you can navigate to messages and their corresponding points on the map.
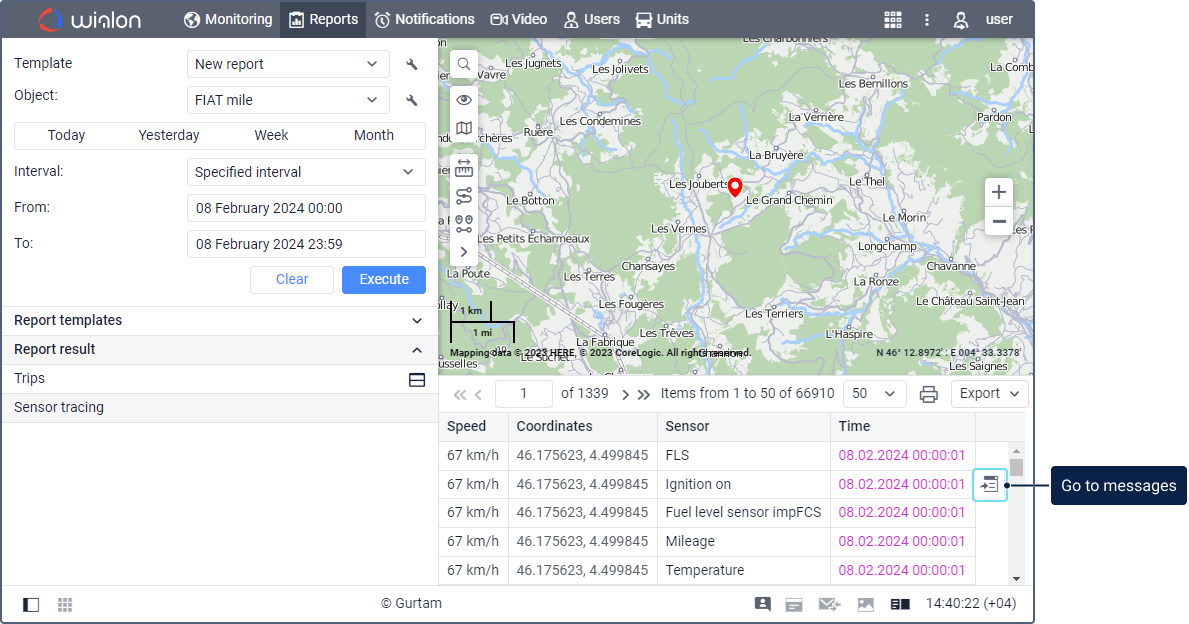
The address and coordinates in the table are blue, while the time values are lilac (for messages with coordinates). When you click on such cells, the corresponding place on the map is indicated with a marker.

When you click on a lilac time value, you can see the icon which allows you to go to the table of data messages. The message received at the selected time is shown first in the table and has a gray background, and the place of its sending is indicated on the map with a marker. To hide the icon
  , right-click on it or press Esc.
If a time value is black, the features described above are unavailable, as there is no location data.
Marks of false fuel fillings and drains
Sometimes filling or draining may be detected by mistake, for example due to incorrect equipment settings or fluctuations in the fuel level in the tank. You can hide such fillings and drains by marking them as false events in the Fuel fillings and battery charges and Fuel drains tables.
To do this, do the following:
-
In the completed report, locate the row that contains the erroneously defined filling or drain.
-
In this row, click on the cell in the Filled or Drained column where the amount of fuel filled or drained is calculated. Then the icon
 or
or  is shown next to the cell.

-
Click this icon. A table row with a false event is indicated by a strikethrough font and a blurred background if the Show false events option is enabled.

If this option is disabled, the row with the false event is hidden.
-
Click Execute on the Reports tab again to have the system recalculate the values.
As a result, the data on fillings and drains marked as false are excluded from the report tables. In particular, the number of fillings and drains, as well as the volume of drained, filled and consumed fuel in the tables of fuel reports and Statistics are recalculated.
In the grouping and Total rows, these data are recalculated only when the Show false events option is disabled. If it is enabled, their values remain as they were before the marks were set.
Markers of false fillings and drains are not shown on the timeline when watching the playback on the Videos tab and in the trip tracks of the Tracks tab.
To remove a false filling or drain mark, click the cell in the Filled or Drained columns and click the icon  or
or  .
.
You can also mark a filling or drain as false on the chart.
Read about how to avoid detection of false drains in the expert article How to get rid of false fuel drains.
Viewing images
You can add the Image column to some report tables in order to see the images received from units. The column displays the number of images and the icon for viewing them ( ).
).

To see an image, click on the icon  .
.

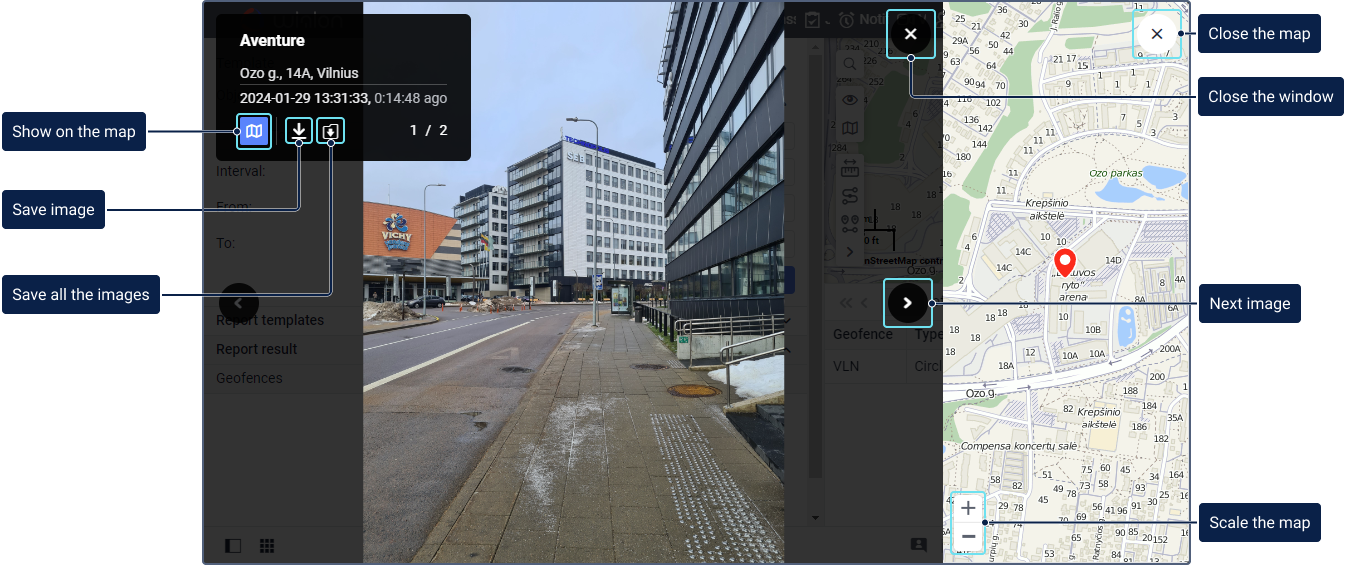
The following information about the image or video is shown in the upper left corner:
- the name of the unit that sent the image;
- address information from the message with which the image was sent;
- the date and time the image was received and how much time has passed since it was received;
- the number of the current file and the total number of images received.
Images can be downloaded individually in the JPEG format by clicking on the icon  , or all together as an archive using the icon
  . The downloaded images contain information about the date, time and place of their sending.
If there are several images, use the left and right arrow buttons to navigate between them.
You can see the place from which the image was sent on the map. To do this, click on the icon  . The map is displayed in the right part of the window and is centred on the place of the image sending. To change the map scale, use the buttons
  /
/ .
.
To close the window for viewing images, click on the icon  .
.