Summary
The Summary table allows you to display a variety of generalizing data related to the reporting interval and, at the same time, not tied to any conditions (such as trips, sensor operation, geofence visits, etc.). In other words, the summary report processes all the messages for the indicated period, regardless of how long the unit worked and was in motion.
The Summary table can include the columns described below.
| Column | Description |
|---|---|
| Mileage in trips | The mileage at the interval taking the trip detector into account. |
| Mileage in all messages | The mileage for the reporting interval by the mileage counter. |
| Mileage (adjusted) | The mileage in trips multiplied by the mileage coefficient. |
| Avg. speed | The average speed at the interval. Calculated as the total mileage from all messages divided by the time between the first and last message in the report interval. Learn more about how the average speed is calculated in reports on the Data in reports page. |
| Max. speed | The maximum speed at the interval. |
| Time in trips | The duration of trips. |
| Engine hours | The time of engine hours operation. |
| Engine efficiency duration | The duration of operation of the attached implements (if there is an engine efficiency sensor). |
| CO2 emissions | The amount of CO₂ emissions during the trips. It is calculated by multiplying the value in the Mileage in trips column by the value specified on the Profile tab in the unit properties. |
| Parkings | The total time of parkings at the interval. |
| Counter | The counter sensor value. |
| Initial counter | The counter value at the beginning of the interval. |
| Final counter | The counter value at the end of the interval. |
| Avg. value of custom sensor | The average value of a custom sensor at the interval. This and the following columns of custom sensor values show a dash if the sensor parameter has a text value or the value is invalid. For example, if the value is not within the bounds set in the calculation table. |
| Min. value of custom sensor | The minimum value of a custom sensor at the interval. |
| Max. value of custom sensor | The maximum value of a custom sensor at the interval. |
| Initial value of custom sensor | The custom sensor value at the beginning of the interval. |
| Final value of custom sensor | The value of the custom sensor at the end of the interval. |
| Difference | The difference between the final and initial values of the custom sensor. |
| Utilization | The percentage ratio of the duration of engine hours to the engine hours rate (engine hours divided by daily engine hours rate indicated in the unit properties on the Advanced tab). |
| Useful utilization | The percentage ratio of the duration of engine efficiency to the engine hours rate. |
| Productivity | The percentage ratio of the duration of engine efficiency to the engine hours duration. |
| Fuel consumed | The volume of consumed fuel detected by any sort of fuel sensor. If several such sensors are available, their values sum up. |
| Consumed by ImpFCS | The volume of consumed fuel detected by an impulse fuel consumption sensor. In the settings of the Summary table, you can select a parameter to calculate fuel: for the whole interval, in trips, or in engine hours. |
| Consumed by AbsFCS | The volume of consumed fuel detected by an absolute fuel consumption sensor. |
| Consumed by InsFCS | The volume of consumed fuel detected by an instant fuel consumption sensor. |
| Consumed by FLS | The volume of consumed fuel detected by a fuel level sensor. |
| Consumed by math | The volume of consumed fuel calculated by math. |
| Consumed by math for FLS | The volume of consumed fuel calculated by math based on the data from a fuel level sensor (FLS). |
| Consumed by rates | The volume of consumed fuel calculated by rates. |
| Energy consumed | The amount of consumed battery energy in kWh calculated using the readings of the battery level sensor. |
| Avg. fuel consumption | The average fuel consumption by all available fuel sensors. |
| Avg. consumption by ImpFCS | The average fuel consumption during the trip detected by an impulse fuel consumption sensor. |
| Avg. consumption by AbsFCS | The average fuel consumption during the trip detected by an absolute fuel consumption sensor. |
| Avg. consumption by InsFCS | The average fuel consumption during the trip detected by an instant fuel consumption sensor. |
| Avg. consumption by FLS | The average fuel consumption during the trip detected by a fuel level sensor. |
| Avg. consumption by math | The average fuel consumption during the trip calculated by math. |
| Avg. consumption by math for FLS | The average fuel consumption during the trip calculated by math based on the data from a fuel level sensor (FLS). |
| Avg. consumption by rates | The average fuel consumption during the trip calculated by rates. |
| Avg. energy consumption | The average battery consumption in kWh calculated using the readings of the battery level sensor. |
| Avg. mileage per unit of fuel by ImpFCS | The average mileage (per one liter/gallon) detected by an impulse fuel consumption sensor. |
| Avg. mileage per unit of fuel by AbsFCS | The average mileage (per one liter/gallon) detected by an absolute fuel consumption sensor. |
| Avg. mileage per unit of fuel by InsFCS | The average mileage (per one liter/gallon) detected by an instant fuel consumption sensor. |
| Avg. mileage per unit of fuel by FLS | The average mileage (per one liter/gallon) detected by a fuel level sensor. |
| Avg. mileage per unit of fuel by math | The average mileage (per one liter/gallon) calculated by math. |
| Avg. mileage per unit of fuel by math for FLS | The average mileage (per one liter/gallon) calculated by math based on the data from a fuel level sensor (FLS). |
| Avg. mileage per unit of charge | The average mileage per unit of charge calculated using the readings of the battery level sensor. |
| Initial fuel level | The fuel level at the beginning of the interval. |
| Final fuel level | The fuel level at the end of the interval. |
| Initial battery level | The battery level in kWh at the beginning of the interval. |
| Final battery level | The battery level in kWh at the end of the interval. |
| Total fillings | The number of detected fuel fillings. |
| Total drains | The number of detected fuel drains. |
| Total charges | The number of battery charges. |
| Filled | The volume of filled fuel (only fuel fillings detected by a sensor). |
| Drained | The volume of potentially drained fuel. |
| Charged | The total amount of battery charges. The system takes into account only the charges detected by the battery level sensor. |
| Penalties | The penalties calculated for the adjusted Eco driving criteria. Penalty averaging for grouping rows (group headings) can be adjusted in report settings. |
| Rank | The received penalty points converted into a grade using a 10-point scoring system. |

If there are several custom sensors, separate columns with average, minimum, maximum, initial and final values and difference are displayed for each of them. The name of each custom sensor and units of measurement (if they were specified when creating the sensor) are indicated next to the name of each of these columns within the parentheses. If required, you can indicate the name masks of custom sensors in the Interval filtering section of the Settings tab.
Fuel can be calculated for the whole interval, in trips or in engine hours, which is selected in the additional parameters of the table. This option affects such columns as Consumed and Avg consumption.
As additional settings, you can specify masks for sensors (fuel, counters), including the engine hours sensor.
The Retrieve intervals option is available for this table if grouping by shifts is configured for it or if a value in the field Summary by: is selected.
The Summary table is presented by one row — the summarized data for a selected period of time. However, the report template parameters for this table contain an individual Summary by option. This option allows you to select a time interval (shifts/days/weeks/months) according to which the table data is arranged. This option can be used either in the reports for units or in reports for units groups.
Often a value received from the analog sensor may differ from the corresponding value in the Total row. It is stipulated by the analog data leaping, and application of grouping by days/weeks/months towards the values received as a result of processing such data. In other words, the analog data values (with or without leaps) are divided into intervals and then summarized. That is why the value of the summarized intervals can be sufficiently different from the value not divided into intervals. And since the values in the Total row are not divided into intervals, you can receive the difference compared to the values from the analog sensors. For example, calculating fuel, a value in the Consumed by FLS column may differ from the corresponding value in the Total row.
Questions and answers
Fuel Fillings and Battery Charges
How to determine fuel consumption, if I know how much fuel the unit consumes within the city, and how much outside it?
Let us suppose that the fuel consumption in the urban cycle is 10 l/100 km and 7 l/100 km — in the suburban cycle.
- Create an ignition sensor (as in the example above) and set 1 l/h for the consumption during idling.
- The average consumption in the urban cycle is 36 km/h, in the suburban — 80 km/h.
- The unit will cover a distance of 100 km driving at a speed of 36 km/h in 2.8 hours. 10 l / 2.8 = 3.57. Let us calculate the value of the increasing coefficient when moving in the city: 3.57 / 1 (idling) = 3.57.
- As a result of a similar calculation for the suburban cycle, we obtain the coefficient equal to 5.6.
- Create an engine efficiency sensor, taking into account the fact that the unit cannot consume less fuel than during the idling, and that it is stationary before the beginning of the movement. As a parameter we use the average speed (speed + # speed) / const2 and fill in the calculation table (manually or using the calculation table wizard):
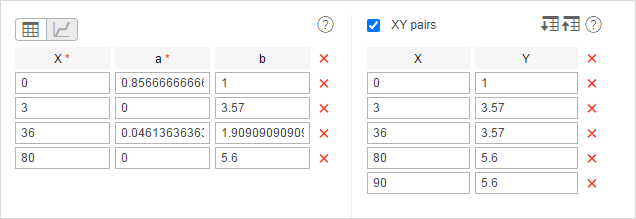
Note that the last pair of points is how the system calculated before (the fuel consumption was considered constant for a speed above 80 km/h). You cannot use this method and change the set of points. Also ‘3’ in this example is the minimum speed from the unit’s trip detector, consequently, this parameter can be different for your unit.
Result: in our example, the average consumption has been calculated for the unit. It has been calculated relative to the speed and time between messages and taking into account the values of the vehicle operation.