Connection problems
The Connection problems table lists the time periods when the system did not receive data from the unit. The parameters for this table are adjusted on the Advanced tab of the unit properties where you set Maximum interval between messages.
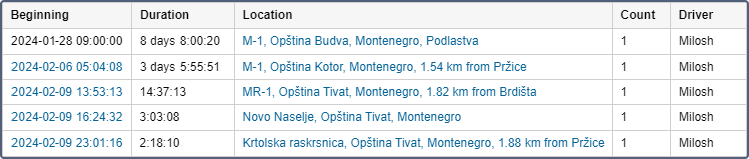
Below is the information which can be presented in the Connection problems table.
| Column | Description |
|---|---|
| Beginning | The date and time when connection loss happened. |
| End | The date and time when the connection was recovered. |
| Duration | The time interval of connection loss. |
| Location | The address where the unit was right before the loss of connection. |
| Count | The number of connection gaps detected in a certain time interval (it is advisable when grouping rows by days/weeks/months or for reports about groups of units). |
| Driver | The name of the driver (if available). |
| Trailer | The name of the trailer (if it was assigned). |
| Notes | An empty column for your custom comments. |
| Video | Files saved during the connection loss using the Video module. To watch them, click on the icon The column is available if the Video monitoring service is activated in the account properties. |
| Image | The images received from the unit. Viewing images in reports and the functions available while doing this are described here. |
If the time passed between receiving the last message for the reporting interval and the end of a report interval exceeds a value of a maximum interval between messages, then a connection loss interval is added to the table. The beginning of this interval corresponds to the time of receiving the last message, and the end corresponds to the end of a reporting interval.
Additional filtering by driver, trailer, and geofences/units can be applied to the Connection problems table.