Eco driving
The Eco driving table provides you with information on how a driver handles the entrusted vehicle. Analysis of the driving behavior can help you extend the life of the vehicle, reduce fuel costs and emissions, ensure cargo safety and also understand the causes of any emergencies.
The Eco driving table is based on violations determined during the whole report interval. The table can include violations determined within trips, engine hours and outside trips or engine hours. This allows detecting violations when the unit is in motion and idling.
Before generating a report with the Eco driving table, you must specify the settings on the Eco driving tab in the unit properties.
The Eco driving table is available for such types of reports as Unit, Unit group, Driver and Driver group.
The “Eco driving” table columns
The table shows the information described below.
| Column | Description |
|---|---|
| Violation | The name of the criterion configured on the Eco driving tab in the unit properties. Possible criteria are:
If grouping by violation is applied, a dash is shown in the column. |
| Beginning | The time when violation began. The grouping rows show the beginning of the first violation interval of the group. The Total row shows the beginning of the first violation interval in the report. |
| Initial location | The address of the unit location at the moment of violation beginning. The grouping rows show the location address at the start of the earliest violation interval in the group. The Total row shows the first location address in the report interval. The time recorded by the device is used. |
| End | The end time of the violation. The grouping rows show the end of the last violation interval of the group of violations. The Total row shows the end of the last violation interval in the report. |
| Final location | The address of the unit location at the end of the violation interval. The grouping rows show the unit location address at the end of the last violation interval in the group. The Total row shows the last location address in the report interval. The time recorded by the device is used. |
| Value | The parameter value during the violation, depending on the criterion:
|
| Avg. speed | The average speed during the violation. See how the average speed is calculated on the Data in reports page. |
| Max. speed | The maximum speed during the violation. If no violations are detected within the trip intervals, the maximum speed value is equal to zero. |
| Penalties | The penalty value indicated on the Eco driving tab of the unit properties. The detailed Penalty scoring system for grouping and Total rows is described below. |
| Rank | The penalty points converted to a 10-point rating system. The column is useful if grouping by years, months, weeks, days, shifts, or trips has been applied. The column is used as the data source for the Rating by violations column in reports on unit groups and groups of drivers. |
| Rating by violations | The Rating by violations column is visible only in the report on unit groups and groups of drivers. The individual index number of a unit or driver calculated on the basis of the committed violations. See the detailed guide in the Rating by violations section below. |
| Trip duration | The column is used with the grouping and Total rows. For grouping by violation, the grouping row shows the total duration of all trips within the report interval, including the trips without violations. For grouping by trips and engine hours, the grouping row shows the trip duration which includes all violations listed in the detailed rows beneath. For other grouping types, it shows the duration of all trips that started within the grouping interval, including the trips without violations. |
| Trip mileage | The column is used with the grouping and Total rows. The information on the trip mileage in grouped and Total rows is based on the same principle as described for Trip duration. |
| Mileage (adjusted) | The mileage for the trip taking into account the coefficient set in the unit properties (the Advanced tab). |
| Duration | The duration of the violation or grouping interval. If the violation is detected on the basis of one message, the cell shows «00:00». |
| Mileage | The mileage in the violation or grouping interval. |
| Engine hours duration | The column is used with the grouping and Total rows. The rows grouped by violation and the Total row show the total duration of all engine hours within the report interval, including the engine hours without violations. For grouping by trips, the grouping row shows the total duration of engine hours that fall within the trip interval. For grouping by engine hours, the grouping row shows the engine hours duration which includes all violations listed in the detailed rows beneath. For other grouping types, it shows the total duration of engine hours that fall within the group interval, including the engine hours without violations. |
| Mileage during engine hours | The column is used with the grouping and Total rows. The information on the mileage during engine hours in grouped and Total rows is based on the same principle as described for Engine hours duration. |
| Initial mileage | The mileage counter value at the beginning of the trip. If the mileage parameter was not saved within the report interval, the mileage is counted from zero. |
| Final mileage | The mileage counter value at the end of the trip. |
| Count | The number of violations of this type. The column is used with the grouping and Total rows. The grouping rows show the number of violations in the grouping. The Total row shows the number of violations in the whole report. |
| Avg. value of custom sensor | The average value of the custom sensor registered during the violation.This and the following columns of custom sensor values show a dash if the sensor parameter has a text value or the value is invalid. For example, if the value is not within the bounds set in the calculation table. |
| Min. value of custom sensor | The minimum value of the custom sensor registered during the violation. |
| Max. value of custom sensor | The maximum value of the custom sensor registered during the violation. |
| Initial value of custom sensor | The value of the custom sensor at the beginning of the violation interval. |
| Final value of custom sensor | The value of the custom sensor at the end of the violation interval. |
| Driver | The name of the driver assigned to this vehicle. |
| Video | Files saved during the violation interval using the Video module. To watch them, click on the icon  (the number of grouped files is indicated to the right of it, if several). If several grouped files are available, you can select the required one in the drop-down list in the upper-left corner. (the number of grouped files is indicated to the right of it, if several). If several grouped files are available, you can select the required one in the drop-down list in the upper-left corner.The column is available if the Video monitoring service is activated in the account properties. |
| Image | The images received from the unit. Viewing images in reports and the functions available while doing this are described here. |
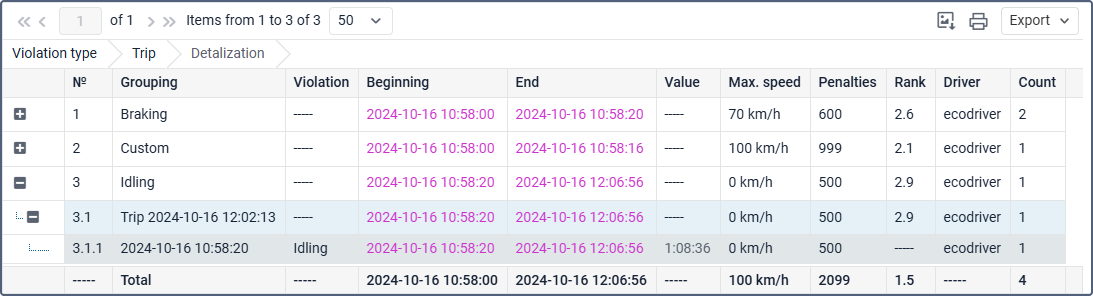
Table settings
Using different table settings you can add the necessary grouping and Total rows and customize the view of your table.
Before generating a table with the added settings and filters, it is advisable to do the following:
- Make sure that the trip detector and the engine hours sensors are configured for the unit.
- Enable the Detalization option to view the information in the grouping rows.
- Specify the Penalty averaging type in the report settings.
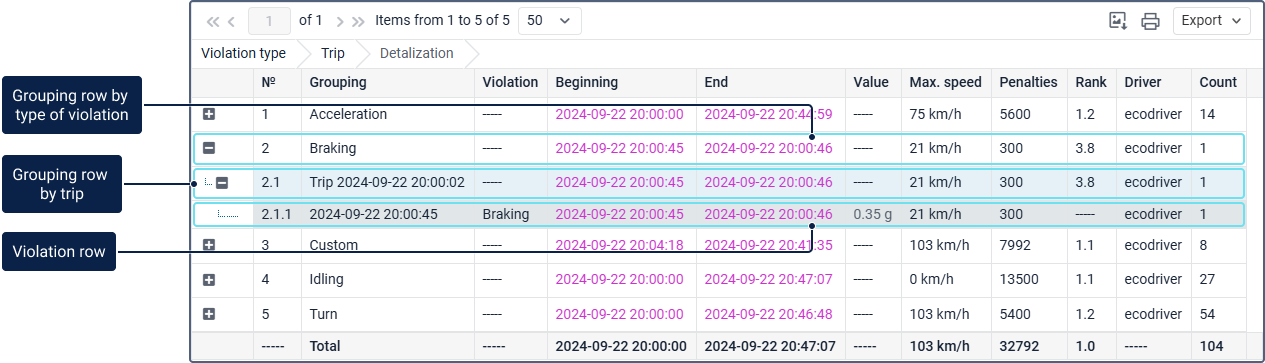
Grouping rows in the “Eco driving” table
You can add grouping by violation type, trip, engine hours, violation duration, day, month, etc. When using grouping, you should enable detalization to view the rows that are included in the group.
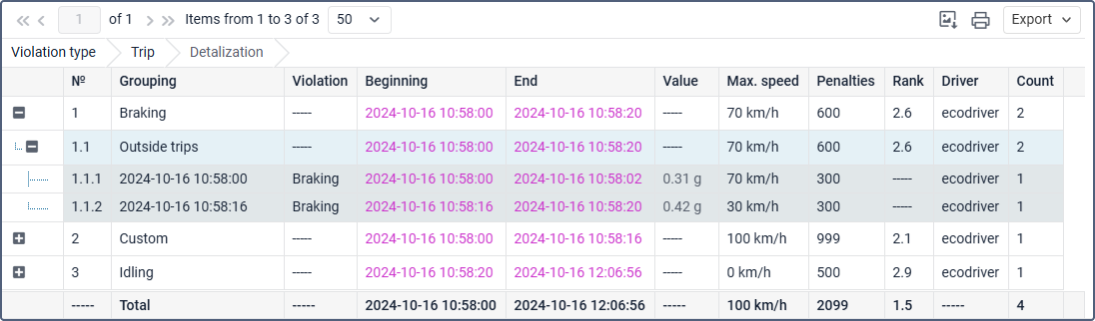
The same violations can enter into several grouping types at the same time. For example, when you group violations by violation type and by trips and several violations of the same type are determined within the trip, the table has three levels. The violation type grouping includes trip grouping and the detailed violations in the lowest third level. The values in the two grouping columns above violations can be summed up or shown according to the column logic. The details on the information in the columns with grouping and the columns without grouping are described in the table above.
If grouping by trip is applied and violations are determined outside trips, these violations are automatically added to a separate grouping row Outside trips.
If grouping by engine hours is applied and violations are determined outside engine hours, these violations are automatically added to a separate grouping row Outside engine hours.
Total row in the “Eco driving” table
You can view summarized information on the entire report table using the Total row.
The peculiarities of the information in the Total row are described in the table above. The values in the Penalty and Rank columns depend on the type of grouping and the selected averaging. Find more details in the Penalty scoring system section.
The “Eco Driving” table filters
The following filters can be applied to the table:
Penalty scoring system
For each criterion, you can specify penalty points which should be credited for violations. Enter the number of points in the Penalty field on the Eco driving tab of the unit properties. The specified points are used when calculating values in the Penalties and Rank columns in the Eco driving table or other tables.
Penalty values depend on how the data is grouped and averaged. This allows you to examine violations in various contexts, such as individual trips, engine hours, or specific violation types.
Penalty points in the rows without grouping
The table rows without grouping show the penalty value indicated on the Eco driving tab. Penalty averaging doesn’t affect individual violation rows, that is, rows without grouping.
Penalty points in the grouping rows
The following table shows how penalties are calculated considering different types of grouping and averaging criteria.
| No averaging | Averaging by trip duration | Averaging by trip mileage | Averaging by engine hours duration | |
|---|---|---|---|---|
| Grouping by violation type | The sum of points for all violations in the group. | The sum of points for all violations in the group divided by the number of minutes of all trips within the report interval. | The sum of points for all violations in the group divided by the number of kilometers in all trips within the report interval. | The sum of points for all violations of a particular type, divided by the number of minutes of all engine hours within the report interval. |
| Grouping by engine hours | The sum of all points for all violations during a particular engine hours interval. | The sum of points for all violations during a particular engine hours interval divided by the number of minutes of all trips within the engine hours interval. | The sum of points for all violations during a particular engine hours interval divided by the number of kilometers in all trips within the engine hours interval. | The sum of points for all violations of a particular engine hours interval, divided by the number of minutes within the engine hours interval. |
| Grouping by trips | The sum of all points for all violations during a particular trip. | The sum of points for all violations of a particular trip divided by the number of minutes of the trip. | The sum of points for all violations of a particular trip, divided by the number of kilometers within the trip. | The sum of points for all violations during a particular trip, divided by the number of minutes of all engine hours within the trip interval. |
| Other grouping rows | The sum of all points for all violations during a particular group interval (for example, a year, a day, a shift). | The sum of points for all violations of a particular group, divided by the number of minutes of all trips within the group interval. | The sum of points for all violations of a particular group, divided by the number of kilometers in all trips within the group interval. | The sum of points for all violations of a particular group, divided by the number of minutes of all engine hours within the group interval. |
Penalty points in the “Total” row
The Total row uses similar principles with some differences from grouping rows.
When no averaging is applied, it shows the sum of points for all violations in the report interval.
When there is averaging By trip duration or By trip mileage, it shows the sum of points for all violations divided by the number of minutes or kilometers of all trips within the report interval. If grouping by engine hours or by trips is applied in the table, the sum also includes the violation points of the Outside trips and Outside engine hours rows, if determined.
When averaging By engine hours duration is applied, the Total row shows the sum of penalty points for all violations, divided by the number of minutes of engine hours within the report interval.
Penalty-rank conversion
The Rank column of the report contains the value calculated on the basis of the received penalty points. It is a score from one to ten.
The following function is used for conversion:
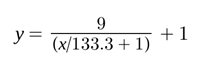 , where
x — number of penalty points,
y — final rank.
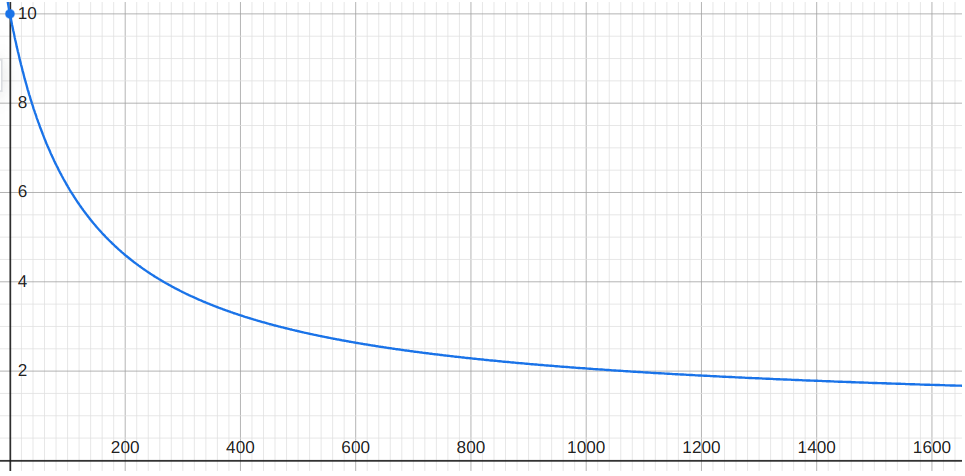
The table below shows how the rank is calculated according to the ten-point rank systems.
Ten-point rank system
In this table, it is shown how the rank is calculated based on penalty points.
| Penalty | Rank |
|---|---|
| 0 | 10,0 |
| 0–17 | 9,0–10,0 |
| 17–38 | 8,0–9,0 |
| 38–67 | 7,0–8,0 |
| 67–107 | 6,0–7,0 |
| 107–167 | 5,0–6,0 |
| 167–267 | 4,0–5,0 |
| 267–467 | 3,0–4,0 |
| 467–1067 | 2,0–3,0 |
| 1067-23861 | 1,0–2,0 |
| more than 23861 | 1,0 |
Rating by violations
The Rating by violation column can be added to reports on unit or driver groups to compare their performance.
Rating by violations is calculated based on the number of violations committed by a driver or a unit. To compare and sort violation data, the system uses values from the Rank column. A lower rating by violation value indicates better performance.
How to use rating by violations
To see the ranked list with colored scores for units or drivers in your report, follow the next steps:
- Create the Eco Driving table in the report on unit group or group of drivers.
- Include the Rating by violations column into the table.
- In the table settings, select sorting by Rating by violations in the Total grouping parameter.
- Add the Unit or Driver groupings.
- In the Interval filtering section, enable the Score-based rating color filter.
- Specify rank values and their corresponding colors in the table or scale mode.
- Run the report.
After that, units or drivers receive their number in the Rating by violations column. The best (lowest) rating point is 1. The unit or driver with the best performance receives the lowest rating points as they committed the fewest violations.
Example.
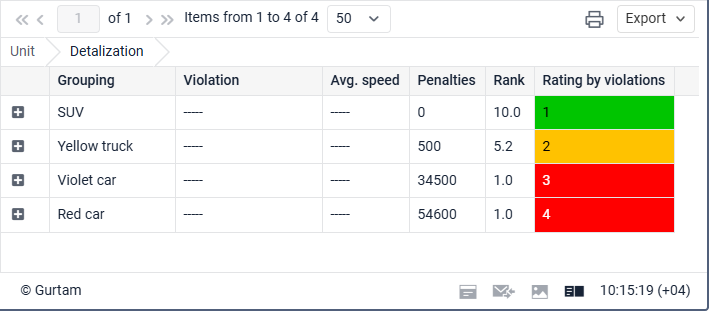
| Unit | Rating by violations | Rank |
|---|---|---|
| SUV | 1 | 10 |
| Yellow truck | 2 | 5.2 |
| Violet car | 3 | 1.0 |
| Red car | 4 | 1.0 |
Rating logic for units or drivers with the same “Rank” values
If multiple units or drivers have the same value in the Rank column, the system uses the selected Penalty averaging method:
-
Averaging By trip duration or By trip mileage:
Units or drivers with bigger trip mileage receive better (lower) ratings. -
Averaging By engine hours duration:
Units or drivers with longer engine hours duration receive better (lower) ratings.
If no averaging is selected (None), rating logic takes into account the penalties. If units or drivers have penalties, the ones with bigger penalty values receive worse (higher) ratings.
Example.
| Unit | Penalties | Rank | Rating by violations |
|---|---|---|---|
| Green truck | 165,000 | 1 | 1 (better) |
| Blue van | 255,700 | 1 | 2 |
The Green truck receives a better rating than the Blue van because it has fewer penalties.
If units or drivers have no penalties, sorting by alphabetical order is applied. If you apply sorting by driver or by unit in the table settings, it prevails over the alphabetical sorting in the Rating by violations column.
Questions and answers
Why are there violations outside trips?
If a violation interval falls in this grouping row, it means that the trip detector is set incorrectly or the wrong grouping type is selected. For example, when an overhead crane is working, the engine is running, but no trips can be detected because the unit is not in motion. If the table is grouped by trips and a violation is detected for this unit, it falls to the Outside trips row.
The example below shows the violations that have been determined outside the trip because of the incorrect settings of the trip detector.