Events
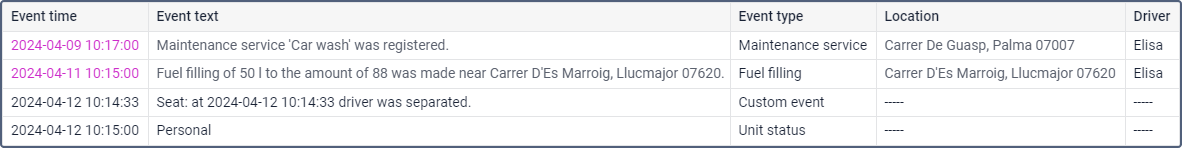
The Events table shows all events (including violations) registered in the system for a unit.
Events for a unit can be registered manually or automatically.
Automatic event registration
Events are automatically registered in the following cases:
- if a notification with the Register event for unit or Register unit status action is triggered;
- if the Save and/or change the value of the mileage counter, Save and/or change the value of the engine hours counter and Save and/or reset the value of the GPRS traffic counter jobs are executed. The Save the counter value in the unit history option must be activated in the job settings.
- if the unit completed a route.
Manual event registration
You can register events manually in the following ways:
- by using the event registration,
- by using the Custom event option in the window of a triggered online notification.
Columns in the “Events” table
The Events table can contain the columns listed below.
| Column | Description |
|---|---|
| Event time | The time when the event happened. |
| Time received | The time when the server received the data. |
| Event text | The text that was specified when creating a notification or when registering an event manually. |
Event type | The type assigned to an event at the time of its registration. It depends on the source and method of registration. See Event types below for more details. |
| User | The name of the user who registered the event. If the event was registered automatically, the field contains the name of the creator of the resource to which the notification or job belongs. If the event type is route progress, the name of the user who created the route is shown. The user name is hidden if you don’t have access rights to view it. |
| Location | The location of the unit at the moment of the event. If the event is registered manually, the unit's location is detected on the basis of messages received upon event registration. The same is true for the events registered by storing counters' values in the unit properties. |
| Driver | The name of the driver (if identified). |
| Count | The count of events. |
| Notification text | The text available upon registering an event from an online notifications window. |
| Notes | An empty column for your custom comments. |
| Event | Depending on the source and method of event registration, the column may show the following values:
|
| Event registration method | This column shows how the event is registered: manually or automatically. See the description of registration methods above on this page. |
| Event name | If the event was registered as a result of a notification or job, the name that the user gave to the notification or job is shown here. In other cases, the event type is shown. |
Events types
In the table below you will find a description of what types are assigned to events depending on the source and how they are registered.
| Event type | Registration method |
|---|---|
| Custom event |
|
| Violation |
|
| Unit status |
|
| Fuel filling | Manually using the event registration, if the Fuel filling type is selected. |
| Battery charge | Manually using the event registration, if the Battery сharge type is selected. |
| Maintenance work | Manually using the event registration, if the Maintenance work type is selected. |
| Mileage accounting | Automatically, if the job Save and/or change the value of the mileage counter with the enabled Save the counter value in the unit history option is executed. |
| Engine hours accounting | Automatically, if the job Save and/or change the value of the engine hours counter with the enabled Save the counter value in the unit history option is executed. |
| GPRS traffic accounting | Automatically, if the job Save and/or reset the value of the GPRS traffic counter with the enabled Save the counter value in the unit history option is executed. |
| Route progress | Automatically, upon completing a route by the unit. |
The “Event” table settings
The following filters are available in the table settings, in addition to general settings:
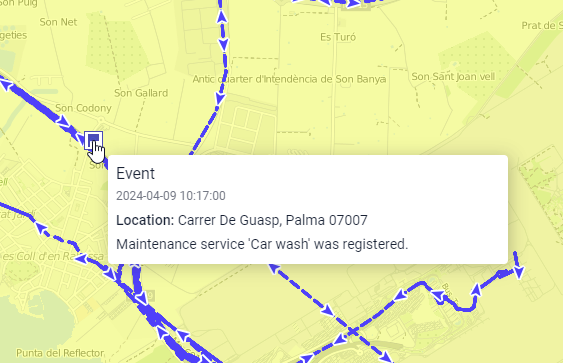
Markers
Besides, you can use special markers for this report: a blue flag stands for an event, a red flag — for a violation. In the tooltip, you can find detailed information. You can add the markers of events and violations in the settings of the report template (Markers section).