Median Filtering of Fuel Level Values
Filtering allows smoothing the values of the fuel level sensor to eliminate data outliers (fuel level fluctuations) that can occur due to various factors. Such factors include engine vibrations, uneven road surfaces, acceleration and braking, ascents and descents, calibration accuracy, tank shape and material, fuel impurities, blockages in the tank and fuel system, temperature changes, and more.
There are two types of filtering available in the properties of the fuel level sensor: median and adaptive median. The difference is that for the first type, you need to specify the appropriate filtering level manually. For adaptive median filtering, you don’t need to do this, as the filtering level is selected automatically based on the data from the unit.
This article explains the ordinary median filtering (not adaptive).
Filtering level
The filtering level determines how many messages should form the filter window, that is, be used to calculate the smoothed fuel level value.
The higher the filtering level, the more the data is smoothed.
If the filtering level is 0, three messages are used for smoothing. In other cases, the number of messages that form the filter window is calculated as follows:
- if the field value is an odd number from 1 to 255, it is multiplied by 5;
- if the value is an even number from 2 to 254, it is multiplied by 5, and 1 is subtracted from the result.
Thus, the greater the filtering level, the more data is used to calculate the smoothed value.
Selecting a suitable filtering level
You should select the filtering level based on how often the device generates messages and how accurate the data from the fuel level sensor is. The more accurate the data, the lower the filtering level required to smooth it.
To select a suitable filtering level, follow the steps below:
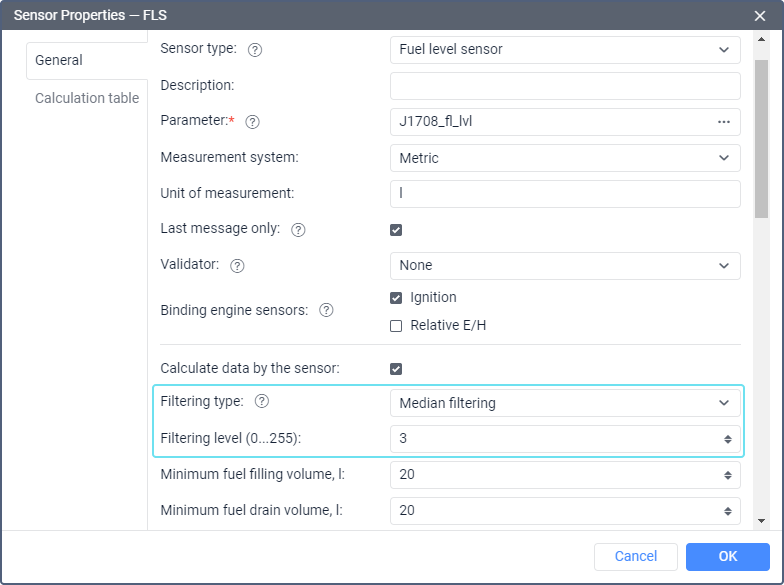
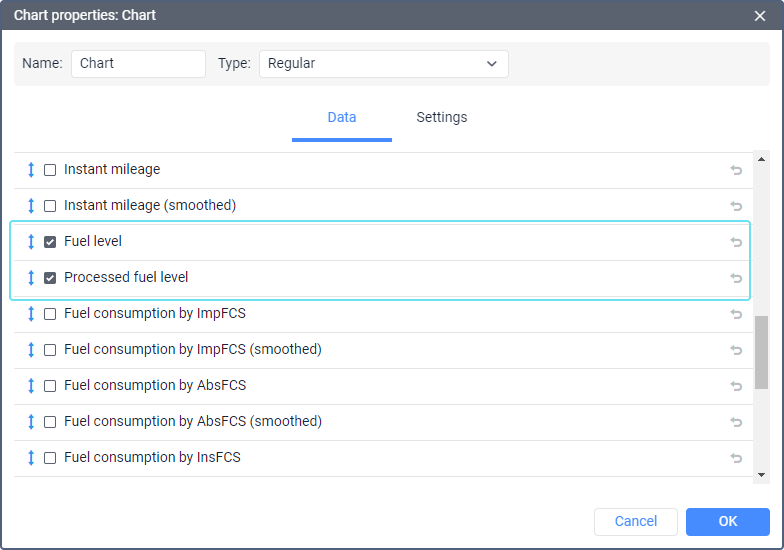
- Create a report template with a fuel level chart. To do this, add a chart of the Regular type to the report template and select the Fuel level and Processed fuel level items for this chart.
- Run this report on the required unit to view its fuel level chart.
- Gradually increase the filtering level starting from 0, running the report again every time. To change the filtering level without switching to another tab, use the icon
 next to the unit name to go to its properties.
When checking the result, analyze intervals of several days with fillings and drains.
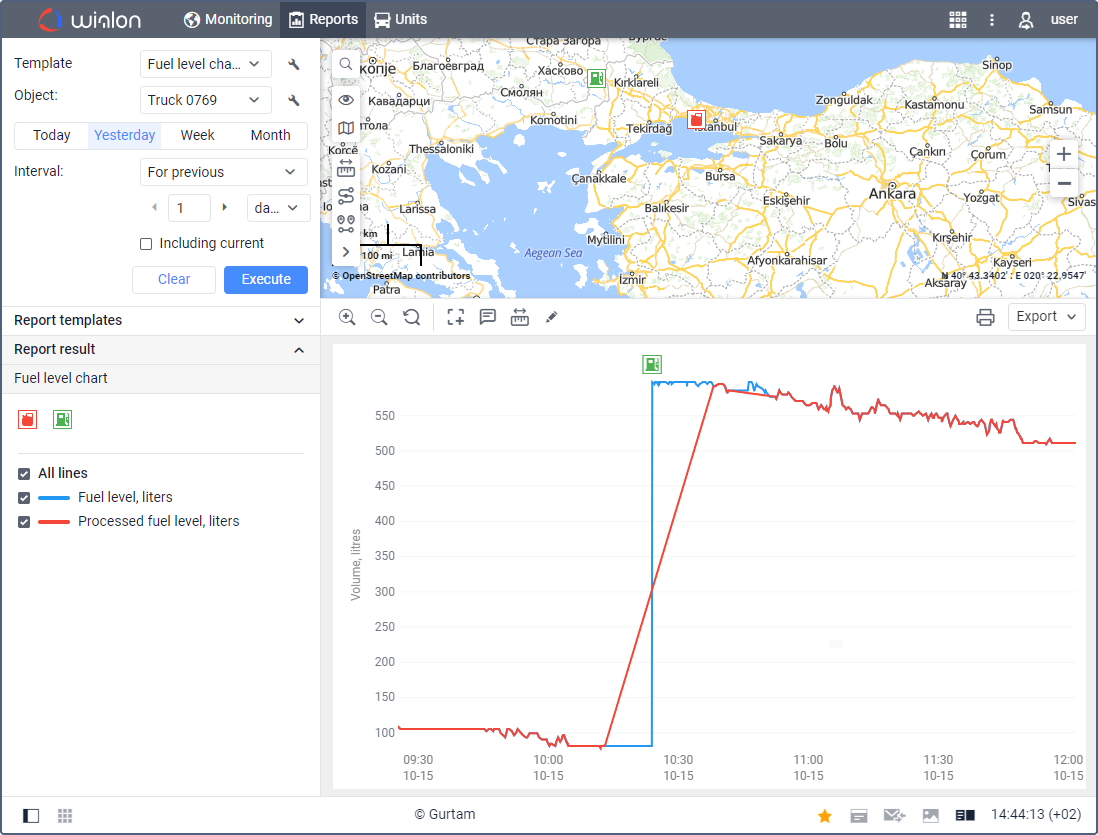
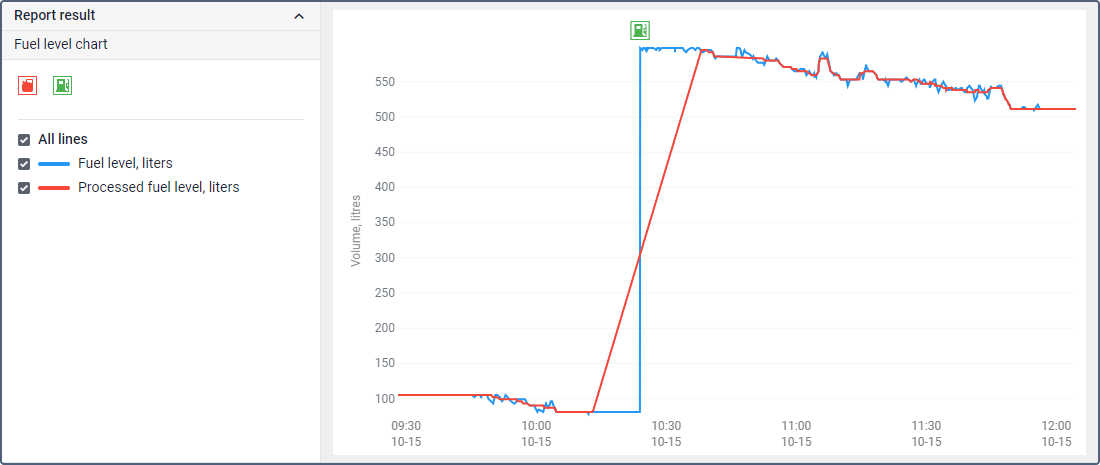
Example of a chart when the filtering level is 0:
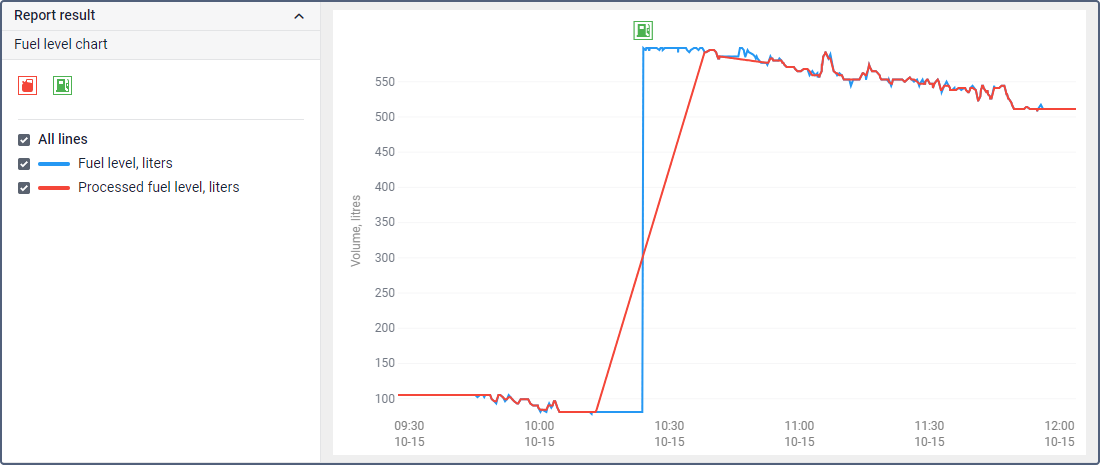
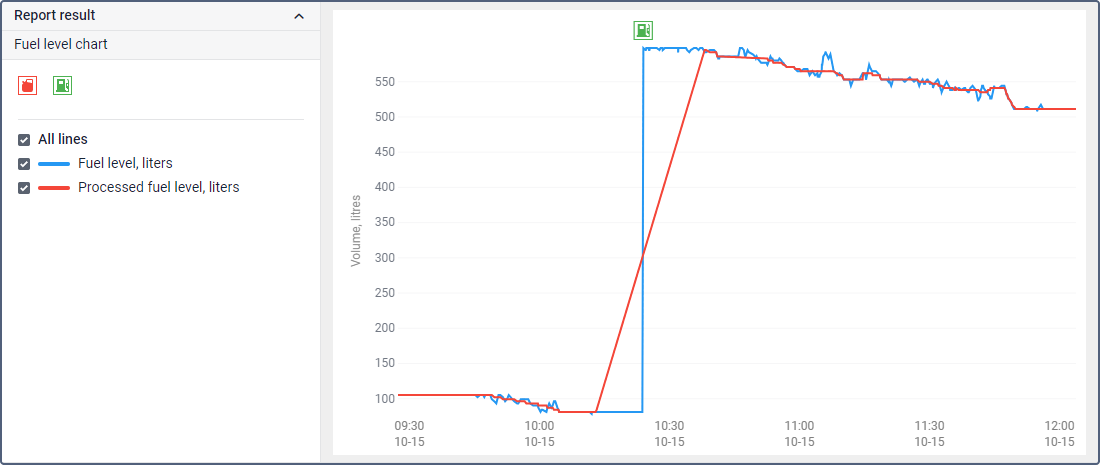
Example of a chart when the filtering level is 3:
- Stop adjusting the filtering level when the Processed fuel level line no longer shows sharp jumps, but still aligns with the average values of the Fuel level line.
Example of a chart when the filtering level is 5:
Use the lowest filtering level you are satisfied with. Too high a filtering level may distort the FLS readings.
As a rule, if you have to use a filtering level greater than 10 to achieve a suitable smoothed result, it means that the incoming FLS readings are not accurate enough. Therefore, even after applying filtering, the results may still lack precision. In such cases, consider addressing the factors listed at the beginning of this article (recalibrate the tank, remove a clog, install a second FLS, and so on).
Median filtering algorithm
In median filtering, data smoothing is applied to each message using the following algorithm:
- The system determines the filter window, that is, the number of messages that will be used to obtain the smoothed value. This number depends on the filtering level. For example, if the filtering level is 2, the width of the filter window is 9 messages.
- The system places the filter window so that the message for which the smoothed value is calculated is in the center of the window. That is, there should be an equal number of messages before and after this message. Only messages with valid fuel level values are taken into account.
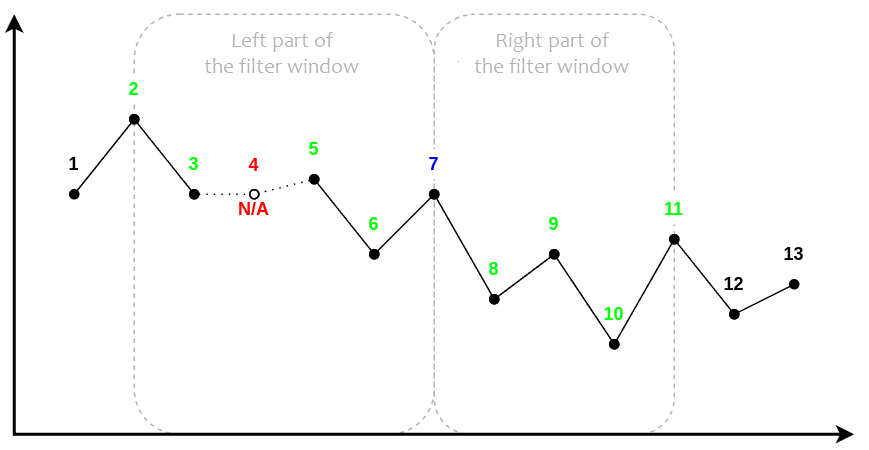
For example, in the image below you can see how the filter window with a width of 9 messages is positioned. The message for which the smoothed fuel level value is calculated is highlighted in blue. It is the center of the window. Messages in green form the left and right parts of the window. Red indicates a message without fuel level data (not taken into account), while black represents messages that are not included in the filter window.
- The values of all the messages in the filter window, including the center message, are sorted in ascending order. For example, if the filter window includes the following values:
41, 52, 49, 46, 50, 42, 42, 39, 47
then in ascending order we get:
39, 41, 42, 42, 46, 47, 49, 50, 52 - The system determines the value at the center of the resulting chain (in the example above, it is 46). This value is considered the smoothed fuel level for the message in question.
Smoothing in real time
When processing data online, the smoothed value is calculated only when the system receives enough unit messages to complete the right side of the filter window. The higher the filtering level specified in the FLS properties and the less frequently the device sends data, the longer this process will take.
Example. A filtering level of 2 is specified in the FLS properties, and the device sends data once per minute. Since the width of the filter window is 9 messages (calculated by the formula 2×5-1), there should be 4 messages to the left and 4 messages to the right of the value to be smoothed. Therefore, it will take 4 minutes to fill the right part of the filter window and obtain the smoothed value.
Smoothing in reports
If the message whose value should be smoothed is at the beginning of the report interval and there are not enough messages before it to form the left side of the filter window, then the value of the first message in the interval is used instead of the missing values. If the message whose value should be smoothed is at the end of the interval and there are not enough messages after it to form the right part of the window, then the value of the last message is used instead of the missing values.
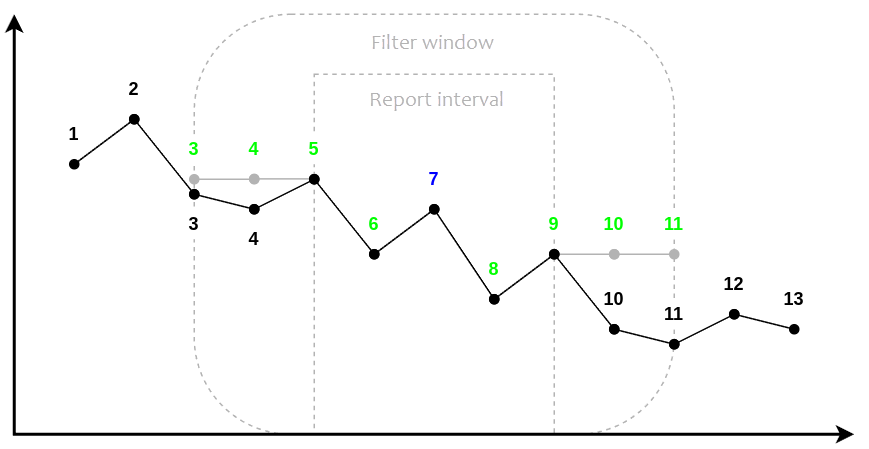
Example. In the image below, the smoothed value for message 7 is calculated.
The report interval includes messages 5 to 9, and the filter window is missing two messages both in the left and right parts. In this case, the filter window is completed as follows: the value from message 5 is used instead of messages 3 and 4, and the value from message 9 is used instead of messages 10 and 11.
Since the actual values from messages 3, 4, 10 and 11 are different from those used in the filter window (compare the gray and black lines), the final smoothed value for message 7 will be less accurate.
Thus, the smoothed result will be less accurate at the beginning and end of the interval if the FLS data changed immediately before and after the interval.
If you generate a report for a relatively large time interval, and then break this interval into parts and generate reports for them, the smoothed result at the end and beginning of the small intervals may not coincide with the values at the same moment in the report for the large interval.
Example. The user runs a report for the week from January 1 to January 7. In this report, the smoothed FLS value is 300 liters on January 2 at 00:00:00. The user then runs a report only for January 2. In this report, the smoothed value at 00:00:00 is equal to 299 liters.