Interface
The main elements of the interface are displayed below.
Top panel
The top panel shows the tabs selected from those available in the menu. The active tab is highlighted in color.
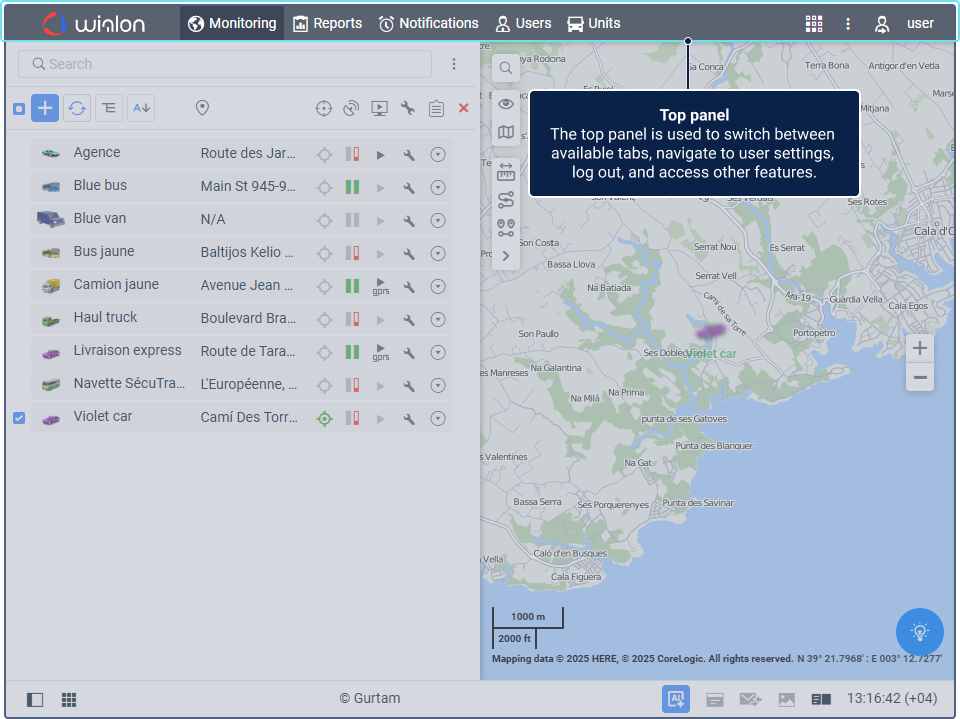
To enable the tabs described later in this guide, follow the next steps:
-
Click on the button
 to open the menu.
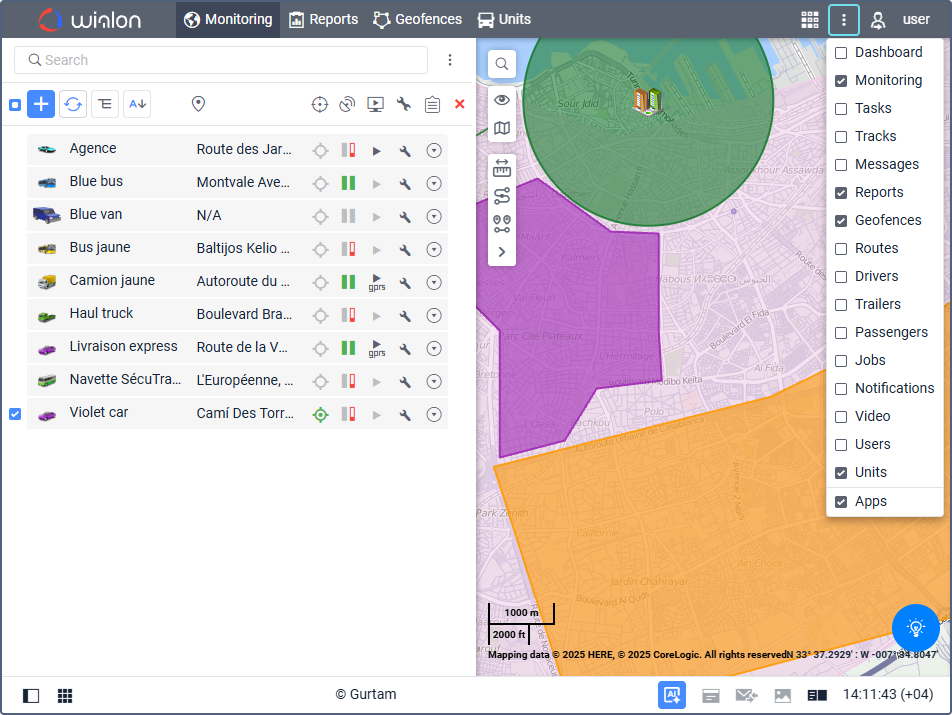
-
Select the Monitoring, Reports, Geofences, Notifications and Units tabs.
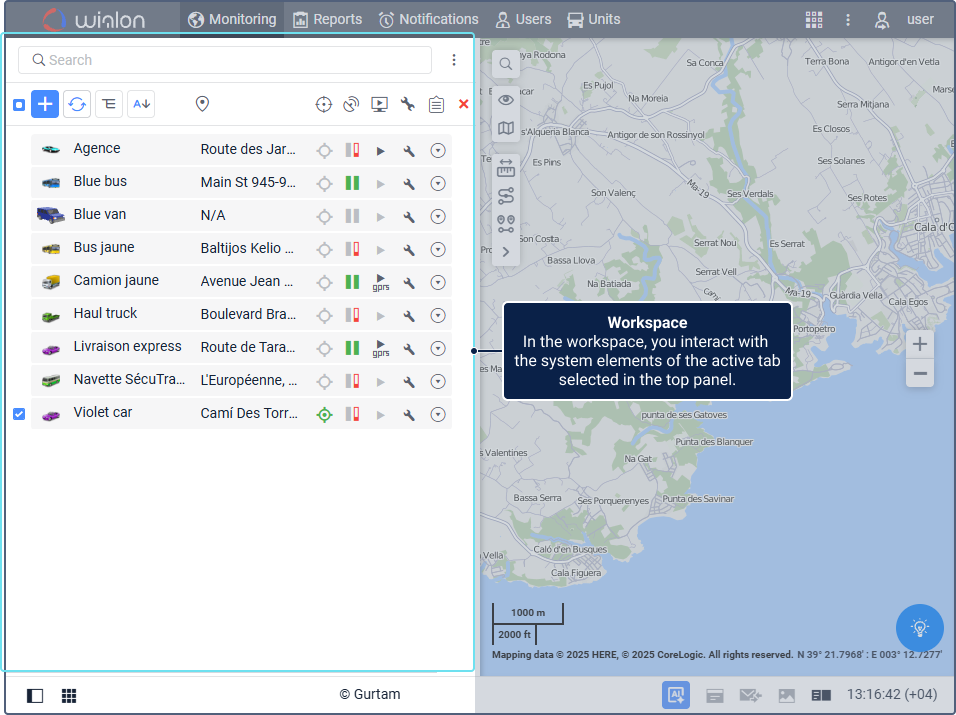
Workspace
In the workspace, you can perform various actions with system objects. The workspace contents depend on the tab you selected above.
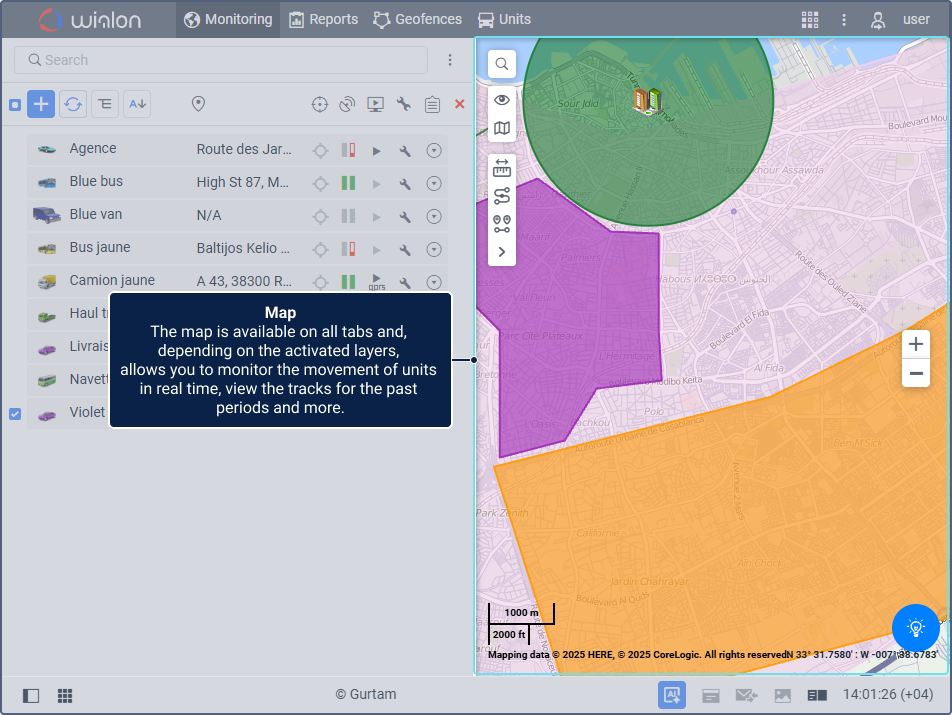
Map
The map is available on each tab. On the map, you can view units and their traces, geofences and other elements.
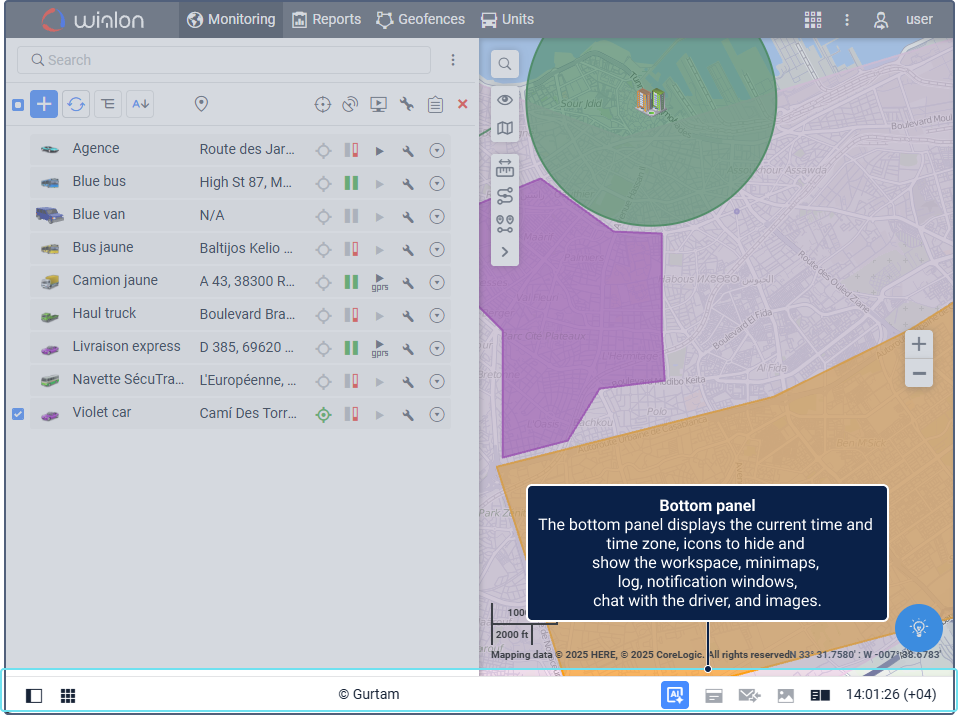
Bottom panel
The bottom panel contains buttons for enabling the visibility of the workspace, minimaps, online notifications, driver messages, media files, and the log. The current time and time zone are displayed in the lower right corner.