Dashboard
On this page, you can see statistics on various aspects of the application operation.
The Dashboard page opens by default after starting the application. You can also open it by clicking on the logo in the upper-left corner.
The work area of the page is divided into four blocks:
- orders;
- routes;
- reports;
- chat.
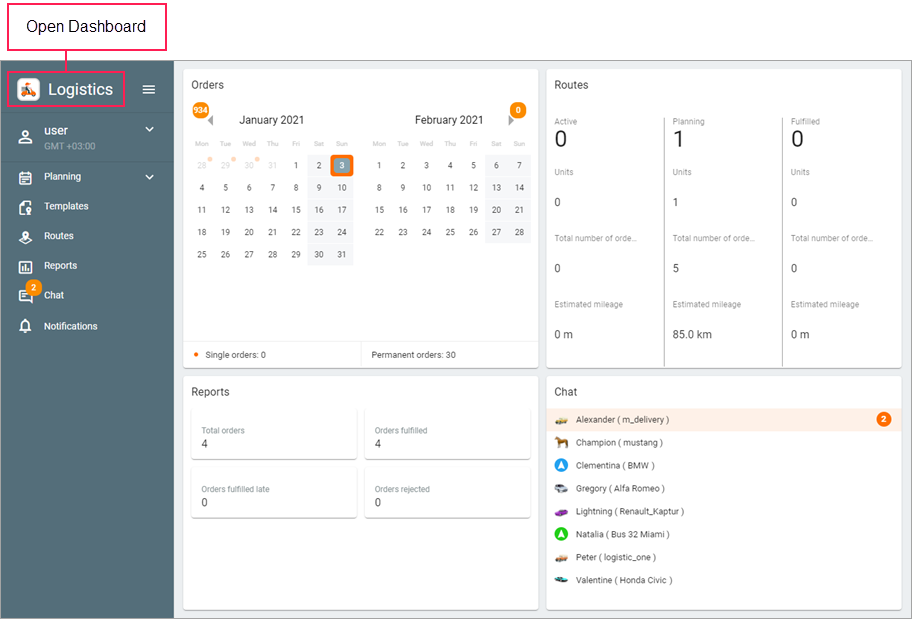
Orders
This block shows statistics on orders for the two months selected in the calendar. Use the icons ![]() and
and ![]() to select the time interval.
to select the time interval.
At the top of the calendar, the number of single orders for all the previous and following months is shown next to the arrows. In the calendar itself, orange markers indicate days with single orders. In the line under the calendar, you can see the number of single orders for the selected two months and the number of permanent orders for the whole time.
Click on any day to go to the Planning page where this day is selected in the Delivery interval filter. If an interval of several days is required, click on the first day of the interval in the calendar and select the required days while holding the mouse button.
Routes
The Routes block contains summary information about active, planned and fulfilled routes.
Each card displays the following information:
- number of routes;
- number of involved units;
- number of orders;
- estimated mileage.
Click on a card to go to the Routes page with filtering by the selected route state.
The block does not display statistics on routes in the archive.
Reports
By default, this block displays statistics on the last executed report for the previous day. To change the time period, select the required interval in the Delivery day field on the Reports page. After refreshing the page, the statistics for the previous day are shown again.
The statistics refer to the unit selected on the Reports page.
To change the contents of the block, open the Statistics section of the report settings and select the columns the data from which should be displayed in the Dashboard. If no column is selected, the block shows the No data to display message.
Chat
The block contains a list of all drivers. When a driver’s message is received, the line with the driver’s name is highlighted in orange and the number of unread messages is displayed. After clicking on the line, the Chat page opens.