

In the General section, you can configure the date and time format, select the measurement system and the thousand separator, and, depending on the type of report, activate other options described below.
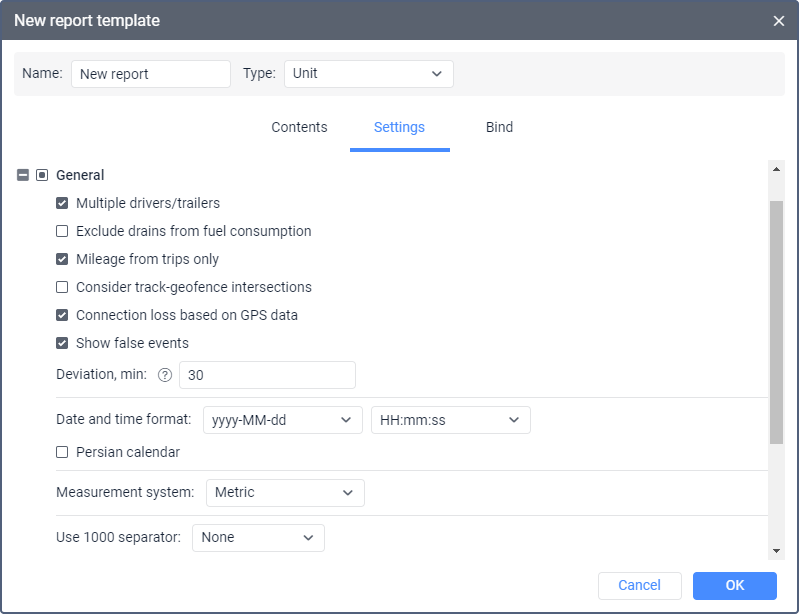
Multiple drivers/trailers
If the report template contains a table with the Driver or Trailer columns, then when this option is activated, they display all the drivers or trailers that were assigned to the unit.
If this option is not activated, the columns show only the driver or trailer that was assigned first. However, if two drivers were assigned to the unit, and then the second of them was separated, the column shows a dash instead of the driver assigned first. In such a case, use the following solutions so that the information is displayed correctly:
- separate the first driver from the unit and assign this driver again;
- enable the Exclusive option in the driver properties;
- activate the Multiple drivers/trailers option in the report settings.
These actions are also applicable to trailers.
Exclude drains from fuel consumption
This option can be useful if you want to ignore drains when calculating fuel consumption in different tables and statistics. By default, however, drains are considered a part of fuel consumption. That is, if the option is enabled, such columns as Consumed by FLS and Average consumption by FLS are calculated without considering fuel drains.
Mileage from trips only
This option affects mileage calculation. If the checkbox is not marked, the mileage is calculated according to all messages without any filtering. If the checkbox is marked, only the part of the mileage that is considered a trip is taken into account.
Consider track-geofence intersections
This option allows you to detect a visit to a geofence in case the trip had an intersection with the geofence by any segment of its track. This option can be applied to such reports as Geofences, and Trips between geofences.
Connection loss based on GPS data
This option can be applied to the Connection problems and Chronology tables, as well as to charts when selecting the background for connection loss. If the checkbox is marked, time intervals with no messages from units or messages without coordinates are shown in the corresponding reports or in charts. If no checkbox is marked, you can see only time intervals without messages.
Show false events
If the option is activated, the reports show fillings and drains marked by the user as false. They can be seen in the Fuel drains, Fuel fillings, Fuel traffic and Chronology tables, as well as on the tracks in the report and on the chart of Normal type. Such a mark can be set only in the Fuel fillings and Fuel drains tables or in the Regular chart.
In the report table the rows with false events are marked with strikethrough font and blurred background. On the chart and on the track, false fillings and drains events are marked with markers ![]() and
and ![]() .
.
If the Show false events option is disabled, false fillings and drains are hidden in all places in the interface.
If the option Show false events is enabled, the marks of false fillings and drains are not shown in the grouping and Total rows. The values in these rows are shown without changes, that is, as if these marks did not exist. Switch off the option so as the data on drains, fillings and fuel consumption could be shown in the grouping and Total rows taking into account the marks.
The option does not affect the calculation of other data in the report, nor does it affect the fillings and drains markers when watching the playback in the Video tab.
Deviation
The possible deviation from the specified filling or charge time in minutes. This value is used for the Fuel fillings and battery charges table to compare the fillings and battery charges registered manually and those detected automatically.
If the same filling has been automatically detected by a fuel sensor and registered manually, the Fuel fillings and battery charges table shows the volume data in one row in the Filled and Registered filling columns respectively. Also, the table shows the difference between the values of these columns.

In order for the volume data to be shown in one row, the time of the filling detected automatically must be the same as the time specified when registering the filling manually. The time of a filling detected automatically is the time of the maximum change in the fuel level.
If a value is specified in the Deviation field, the time of the filling registered manually may be different from the time of the one detected automatically. It may be earlier or later, but the difference must not exceed the value specified in this field.
Example. A fuel filling has been detected automatically. Its time (the time of the maximum fuel level difference) is 12:57:49. When registering the filling manually, the user specifies 12:55:00 in the Date field and 30 minutes in the Deviation field. Since the difference is about 3 minutes and doesn’t exceed the value in the Deviation field, this filling is considered one and the same. The filling volume determined automatically is shown in the Filled column, and the volume specified manually is shown in the Registered filling column in the same table row.
The same logic is applied to battery charges. The value determined by the battery level sensor is shown in the Charged column, and the value registered manually is displayed in the Registered charge column.
Skip empty rows
This option allows you to hide the rows without any data.
Date and time format
This option allows you to select a convenient format for displaying the date and time. Initially, the date and time mask parameters are taken from the User settings dialog. However, they can be changed at your discretion.
Persian calendar
This option makes it possible to use the Persian solar calendar in the resulting report for the fields with the indicated date.
Measurement system
This option defines the units of measurement for such parameters as mileage, speed, fuel, and temperature in reports.
Depending on the measurement system selected in the report template for which the interval filtration has been applied, you should remember that the values of filtration parameters are not converted into the corresponding values of another measurement system. Nonetheless, the units of measurement are changed to the corresponding units of measurement of the selected system. For example, if you have 50 kilometers mileage and 100 kilometers per hour speed, after choosing the US measurement system, you receive 50 miles mileage and 100 miles per hour speed.
Use 1000 separator
In the drop-down list, you can select the character that should be used to separate groups of thousands in numbers. The following options are available: space, comma, single quote. When exporting the report to an XLSX file, a comma is used as a separator regardless of which of the three options is selected. No separator is used by default.