How to get rid of false fuel drains
If data received from the tracker meets all the drain detecting criteria, the Fuel Drains table will contain records about it, even if there was no actual drain. Such fuel drains are called false.
To correctly configure fuel drain detection, you need to know not only the technical features of Wialon algorithms but also the operating principles of hardware (trackers, sensors, and the unit’s fuel system). This article provides simple instructions, following which you can eliminate false fuel drains by focusing on the fuel level chart only.
There is a possibility to mark drains as false and then hide them from the report result (the Show false events option in the report template settings should be disabled). Such an approach is used when current settings of the fuel level sensor are regarded as optimal for the unit, but sometimes the system still display incorrect drains according to the incoming messages.
Marking drains as false is a manual action, while this article is mainly focused on changing sensor properties that can hide all false drains automatically.
Required steps before applying instructions
- A unit is created in Wialon, data messages from the tracker are displayed in the system.
- The fuel level sensor is connected to the tracker, the fuel tank is calibrated.
- A sensor with the Fuel level sensor (FLS) type is created in the unit.
- The Calculate data by the sensor option is activated in the FLS settings.
- The calibration table (XY pairs) is added to the fuel level sensor Calculation table, whereafter the Generate button is clicked.
- A report template with a Regular type chart is created, which displays the Processed fuel level.
- The chart also displays fuel drain markers and the background of trips (it’s pink by default), stops (blue), and engine hours (yellow).
Chart behavior in the location of false fuel drain
Choose one of the options below according to what you see on the chart where the fuel drain marker is located.
1. Jumps during motion or engine operation
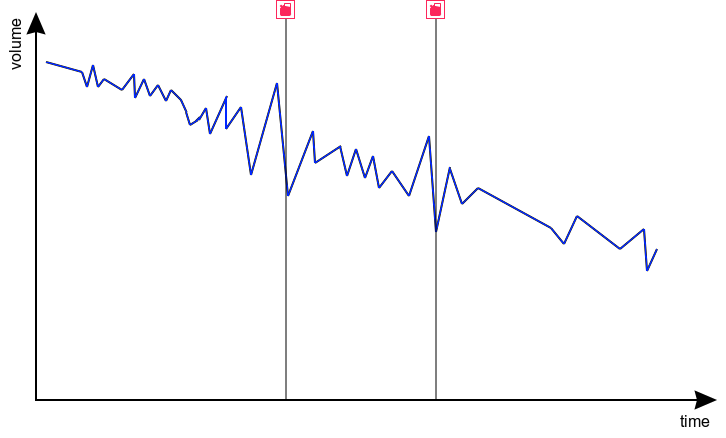
During engine operation, driving on uneven surfaces or basically any movement, fuel fluctuations occur, and the FLS reads them. Depending on the tank volume and shape, as well as the FLS location, these fluctuations can reach dozens of liters, which can result in detected fuel drains. In general, you can compensate them with the help of a smoothing algorithm.
To do this, set filtration type to Adaptive median filtration in the fuel level sensor settings. In this case, the algorithm automatically calculates the appropriate value of filtration level.
As an alternative you can set filtration type to Median filtration to manually tune the smoothing algorithm. E.g. set the filtration level to 3. Keep in mind that high filtration levels should be used only with a high frequency of message sending (1-5 seconds between messages). After applying the filtration, fuel algorithms will work not with the raw data but with smoothed data.
To check if smoothing is effective, add the Fuel level line (before smoothing) to the chart and compare it with the Processed fuel level line (after smoothing). If the Processed fuel level line fluctuations still seem significant to you, try to increase the filtration level (an increment of 1 is recommended). But don’t forget that smoothing may distort the input data, that’s why you have to find the middle ground: Processed fuel level line fluctuations no longer seem significant (or they are eliminated), but at the same time, the lines before and after smoothing are still not much different in distinctive points (for example, during actual fillings/fuel drains).
2. A sharp jump immediately after the start or stop of motion
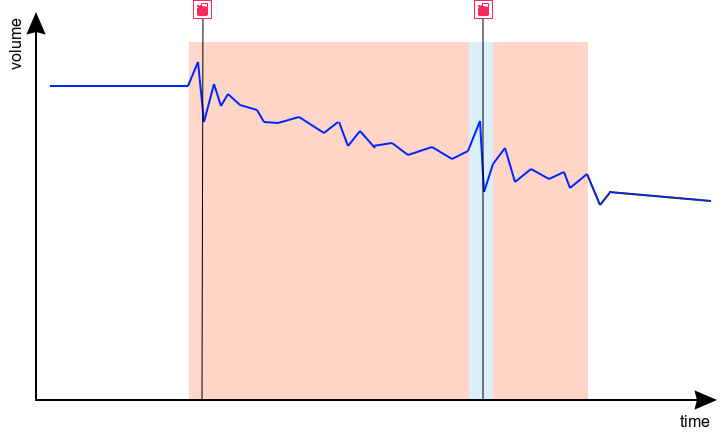
FLS readings can change abruptly at the moment of motion start/stop, which can result in fuel drain detection. If the chosen filtration level doesn’t smooth out these jumps, and you don’t want to increase it (for example, in your case, this causes significant distortion of input data at other intervals), then you can use one of the two time filters in the fuel level sensor settings:
- Ignore messages after the start of motion — this option allows you to exclude a specified number of seconds after starting the movement from the fuel drain analysis.
- Minimum stop duration to detect a fuel drain — if the duration of the interval without movement doesn’t exceed the specified one, then this interval won’t be analyzed for fuel drains (thus, you can cut off fuel level fluctuations, for example, during short stops at traffic lights).
3. Smooth falling with the running engine and no movement
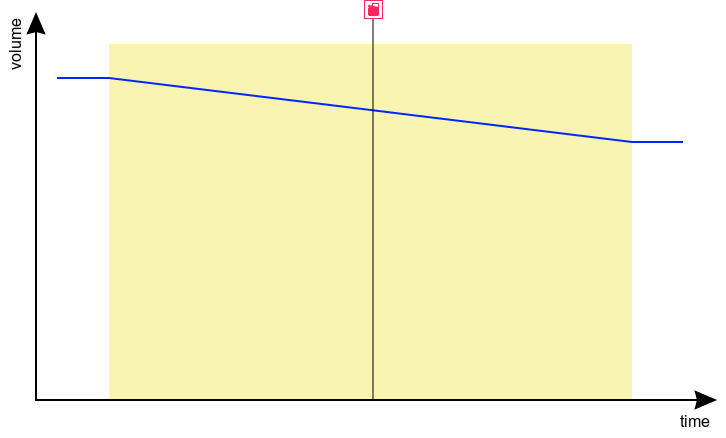
There are two algorithms for fuel analysis in Wialon: the mileage-based algorithm (used by default) and the time-based algorithm. For stationary units and units with long idle intervals, it’s recommended to use the time-based algorithm. To do this, activate three options in the fuel level sensor settings: Calculate fillings by time, Calculate drains by time, and Calculate fuel consumption by time. We should clarify that in this very case, it would be possible to do only with the Calculate drains by time option, but the simultaneous activation of all options will allow you to achieve better convergence of all fuel indicators in the reports.
When using the time-based algorithm, the FLS fuel consumption value is compared with the calculated fuel consumption value, i.e., with the value calculated by the mathematical model. At idle intervals, the calculated fuel consumption value is generally determined by the engine ignition sensor or engine hours counters. Therefore, open the ignition or engine hours sensor properties and check if the correct consumption rate per hour is set in the Consumption field.
4. Fuel drain during driving, although the chart looks normal
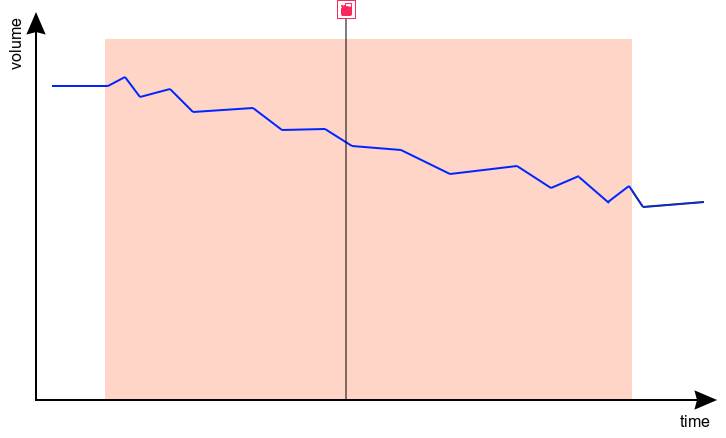
Most likely, you are using the time-based fuel analysis algorithm, and you’ve also activated the Detect fuel drain in motion option in the fuel level sensor settings. In this case, the FLS fuel consumption value is compared with the mathematically calculated consumption. If the consumption by calculation is set incorrectly, a false fuel drain can be detected when the unit is just making a trip; therefore, it’s recommended to check the mathematical model of the calculated consumption. It’s set via:
- engine ignition sensors or engine hours counters — in the properties in the Consumption field specify the consumption rate per hour at idle;
- engine efficiency sensors — this sensor can use any parameter that affects fuel consumption and based on its value, it determines the fuel consumption change coefficient, which is then multiplied with the consumption value from the previous point.
A basic mathematical consumption model can be created using the Math consumption wizard on the Sensors tab in the unit properties. This model includes the affect of speed and season on the consumption with a help of engine efficiency sensors. Further, you can complement this model, adding more engine efficiency sensors that take into account other factors affecting the consumption (cargo weight, temperature, operation of vehicle attachments, and so on).
5. Significant jumps to the minimum/maximum
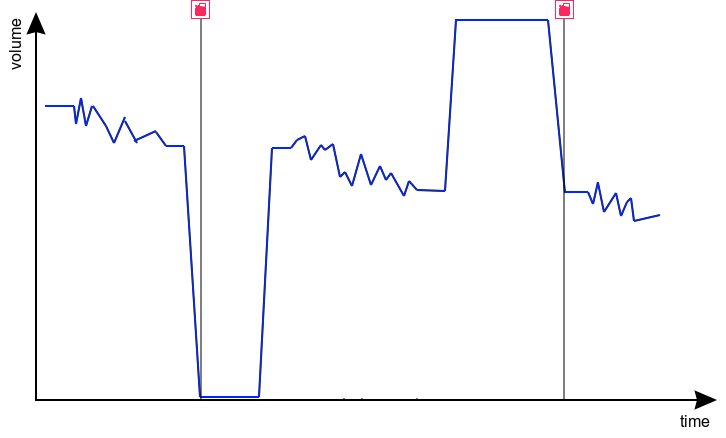
If the chart shows jumps of the Processed fuel level line to 0 or to the maximum value (often 2¹⁶-1 = 65535) and back to the actual value, then even after applying the smoothing, these jumps can cause the detection of false drains. Such jumps in readings can be connected with the wrong configuration or the connection of the fuel level sensor itself.
It’s recommended to fix this problem on the hardware side; however, on the Wialon side, you can try to cut off these readings using the Calculation table. To do this, go to the FLS settings, go to the Calculation table tab, and set the values of the Lower bound and/or the Upper bound corresponding to an empty and full tank. In the lower bound, however, it’s better to set not 0 but a value close to zero (for example, 0.1) to cut off false jumps in readings to 0.
6. Significant jumps not to the minimum/maximum
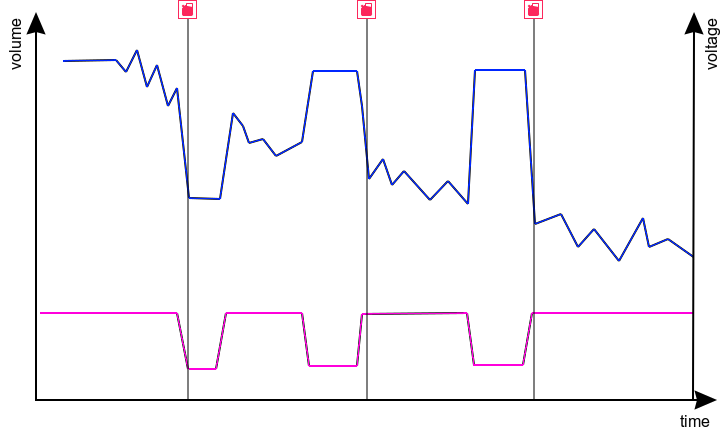
If the FLS readings change by significant values (but not to 0 or the maximum value) and then return to the actual value, even after applying the smoothing, these jumps can cause the detection of false drains. Such behavior can be connected with voltage surges, which can be seen on the chart using the Voltage line if you have a Voltage sensor.
It’s recommended to fix such situations on the hardware side; however, on the Wialon side, you can try to neutralize the impact via Validation. To do this, follow the instructions:
- Open the Messages tab and request raw data messages for the interval that includes the considered fuel level jump.
- Manually or using a filter, find another parameter that changes simultaneously with the FLS readings. Suppose this is the pwr_ext parameter, which for most trackers corresponds to the external voltage.
- Determine, upon passing which value of the found parameter, the FLS readings change. Suppose that if pwr_ext is less than 12, then the FLS starts sending incorrect readings.
- Enter the unit properties and create a sensor with the Custom digital sensor type using the parameter from point 3, and then define a Calculation table for it with the following lines: X = 0; a = 0; b = 0 X = 12; a = 0; b = 1
- Save the created sensor and the changes of unit properties by clicking OK twice.
- Enter the unit properties again, and then the FLS properties. Specify the sensor from point 4 as a validator with the Not-null check type.
In the example above, a real case is considered since low voltage actually often leads to the distortion of readings of different sensors. This means there is a direct connection between the transmitted parameters of voltage and fuel level. However, you can also use a correlation if you notice a simultaneous change in the FLS readings and any other parameter. Perhaps the tracker doesn’t send a voltage value, but it does send a temperature value, and the temperature sensor also fails and sends, for example, 451 °F at the moment of a power surge. In this case, using validation, try to connect the FLS and the temperature value, which should also correct the situation.
7. Smooth falling after filling when there are several interconnected tanks with an FLS in each
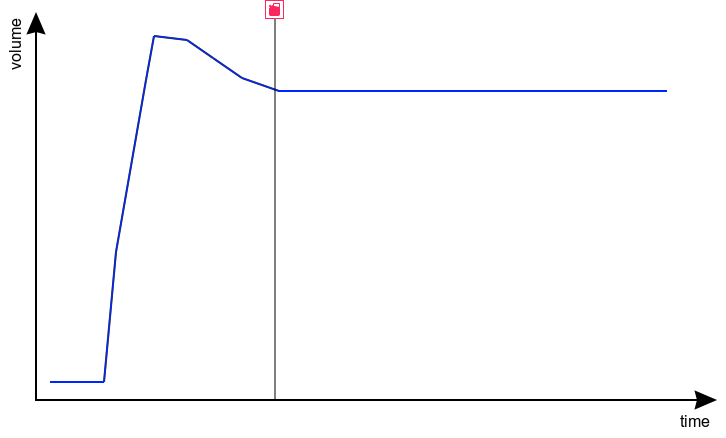
Such a change in the FLS readings may be because the unit has several interconnected tanks and fuel flows between them. After filling one of the tanks, the equalization of levels between several tanks may take some time. If you created fuel level sensors in Wialon separately, the system can detect false drain in one of the tanks immediately after filling.
When working with several interconnected tanks, we recommend you to create a Custom sensor for each FLS (for example, named “FLS 1” and “FLS 2”) and add your calibration table into them. After that, create a separate sensor with the Fuel level sensor type, don’t add the calibration table into it, but instead just use the following formula: [FLS 1]+[FLS 2]
8. Sharp falling when reaching a certain level
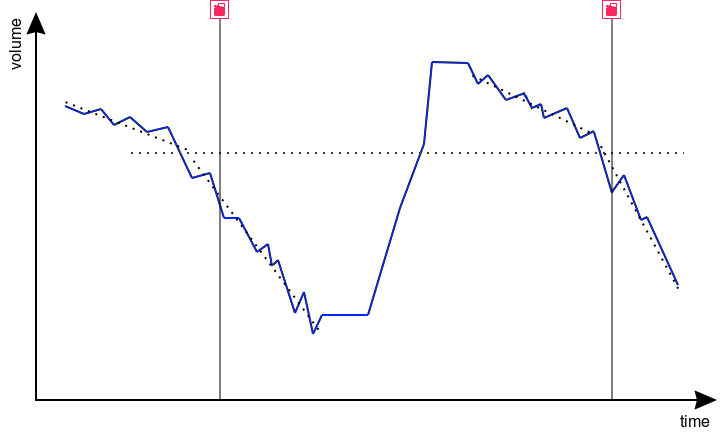
This situation can be observed for tanks of a specific shape at the moment of transition from a wide part to a narrow one (for example, L-shaped tanks). This is particularly likely if the calibration was performed using too few points, and often it’s done using only two points (for an empty and full tank). Therefore, it makes sense to re-calibrate the tank using small portions.
9. Smooth change at the same time
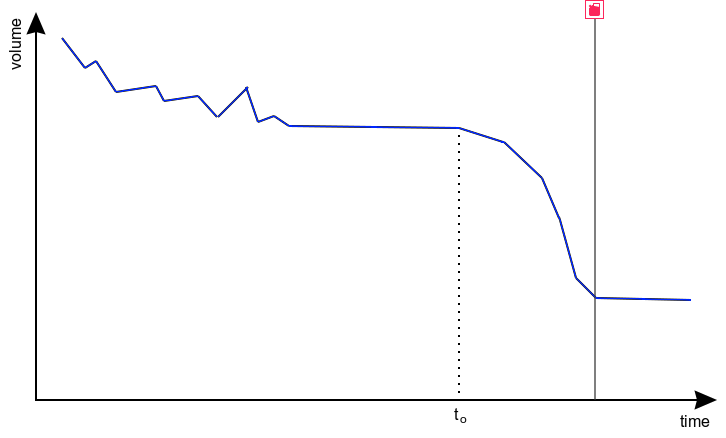
Sometimes the fuel level drops/rises at specific points in time, and in some cases, later even returns to the actual value. This can happen at night, or during a trip (especially when loaded), or after approximately equal time after the end of the trip — it’s difficult to identify a common rule.
Possible reasons:
- temperature change, affecting the fuel volume and the tank deformation (this is especially true for flexible plastic tanks);
- a “vacuum” created due to the pressure difference (active intake of fuel into the engine);
- sedimentation of impurities in the fuel or dirt in the tank, happening after the end of the trip (shaking).
The solution in most cases is related to the hardware: using a fuel tank cap with a valve to equalize pressure, dirt/sediment removal in the tank or on the FLS. However, if the situation is related only to temperature changes, then using a sensor with the Temperature coefficient type can help you (you can find an example of its setting in the documentation).
None of the variants work
This article discusses only false fuel drains, so if you couldn’t get rid of drains using the suggested instructions, this may mean one of three variants:
- The FLS accuracy is insufficient for a given tank shape, type of vehicle, mode of motion, terrain, etc. The only thing that can help is increasing the Minimum fuel drain volume value in the fuel level sensor settings. In fact, this is not a problem solution, but simply the recognition of the FLS low accuracy and the unit adjustment according to this accuracy.
- You are faced with a more complicated situation than those discussed above, and you should contact technical support via support@wialon.com. Make sure to indicate in your email a brief description of the situation with screenshots, the exact unit name, the report template name for verification, the minimum time interval for verification (for example, not a month, but one day) and other essential details.
- Probably, the fuel drain actually took place.
