On the Monitoring tab, the latest data on units, such as speed, trip duration, fuel level, sensor values, address, is displayed in the unit section. It is available in the unit work list and unit detailed information.
From the unit section, you can also access the unit menu by tapping the icon .
Below, you can find the description of the data that can be shown in the unit section and how to customize the unit section view.
Data available in the unit section
Copied!
The table below lists the components that can be shown in the unit section depending on your selection.
Consider the following particularities regarding the determination of the unit address:
If the Geofence item is selected, but the unit is outside the geofences, the unit address is displayed.
If the unit location data is currently unavailable (for example, when travelling in private mode), the last known location is shown.
If Google is selected as a geodata source in the user settings in Wialon, then this source is used for geocoding. In all other cases, geocoding is carried out by Gurtam Maps.
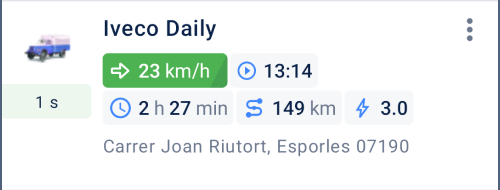
Indicators
Any or each of the following items:
/ speed if the unit is moving or a parking sign if the unit is parked;
movement start time if the unit is moving or parking start time if the unit is parked;
movement duration if the unit is moving or parking duration if the unit is parked;
mileage in the current trip;
current fuel level if there is a fuel level sensor and correct data has been received recently. To have the indicator shown in the unit section, enable the Calculate data by the sensor option in the fuel level sensor settings;
current battery level if there is a battery level sensor and correct data has been received recently. To have the indicator shown in the unit section, enable the Calculate data by the sensor option in the battery level sensor settings.
video availability. If this icon is displayed in the unit section, you can receive video from the unit cameras.
If the last unit message was received 7 or more days ago, the indicatiors are not shown.
Consider the following particularities regarding the fuel level and battery level data:
If there are several sensors of one type with the Calculate data by the sensor option enabled, the sum of their values is shown.
If filtration is configured for the sensor, the unit section displays its raw value, whereas the extended unit information (the Sensors tab) shows a filtered one.
The fuel level is displayed in those units of measurement that are selected in the user properties. They are updated when you sign in to the application.
The battery level is displayed only in kWh.
Sensors
The unit section can show the values of the sensors created in the monitoring system. To see them, you must have the Request reports and messages access right to the unit.
You can select up to 10 sensors you want to see in the unit section.
If a unit has several sensors with the same names, the section shows only the value of the first of these sensors.
The icon corresponding to the sensor type is shown next to the value:
mileage sensor
relative odometer
engine ignition sensor
alarm trigger
private mode
real-time motion sensor
custom digital sensor
voltage sensor
weight sensor
accelerometer
temperature sensor
temperature coefficient
engine revolution sensor
engine efficiency sensor
absolute engine hours
relative engine hours
impulse fuel consumption sensor
absolute fuel consumption sensor
instant fuel consumption sensor
fuel level sensor
impulse fuel level sensor
battery level sensor
counter sensor
custom sensor
driver assignment
trailer assignment
passenger sensor
Bottom row
One of the following items:
address where the unit is located
geofence within which the unit is located
The particularities regarding the determination of the unit address are listed above.
Customizing unit section view
Copied!
You can change the way the section looks. To do this, go to its settings in one of the following ways:
Tap the icon in the work list on the Monitoring tab and select Configure unit section.
Select Unit section on the Settings tab.
In the settings, you can select which components to display in the unit section to adapt it to your monitoring needs.
If you find a mistake in the text, please select it and press Ctrl+Enter.
 .
.
 video availability. If this icon is displayed in the unit section, you can receive video from the unit cameras.
 in the work list on the Monitoring tab and select Configure unit section.