Detailed unit information
The prerequisites for accessing the unit information are listed on the Monitoring page.
To access the detailed information about a unit:
- Open the Monitoring tab in the navigation bar.
- Tap the required unit section in the work list.
- Select the Info tab.
Info tab overview
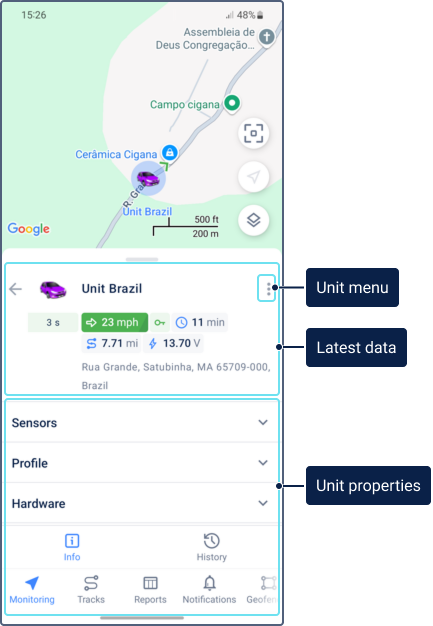
The Info tab displays:
- Unit location on the map: The unit location on the map based on the last message.
- Latest data: Real-time information as described on the Unit sections with latest data page.
- Detailed unit information: Detailed unit data, such as, sensor values, profile properties, device type, unique ID, organized into sections.
From the Info tab, you can also access the unit menu by tapping the icon  .
.
Sections in detailed unit information
Detailed unit information is based on the unit properties and can only be edited in the web version. After a long tap on the line with the property, its value is copied to the clipboard.
This information can include the following sections:
| Tab | Description |
|---|---|
| Custom fields | The custom fields added on the same-name tab in the web version of Wialon. |
| Sensors | The sensors for which the Visible option is enabled on the Sensors tab in the web version of Wialon. The order of sensors depends on their order configured on the tab. Tap on a sensor row to view a chart with historical sensor values. See the Viewing sensor data section for more details. If filtration is configured for a fuel level sensor, the unit information shows its filtered value. The unit section, by contrast, displays the raw value. You can choose how fractional values of sensors should be rounded in the user settings in the Wialon web version. |
| Profile | The unit characteristics specified on the Profile tab in the web version of Wialon. |
| Hardware | The device type and unique ID specified on the General tab in the web version of Wialon. To see this information, you must have the View connectivity settings access right to the unit. |
| Counters | The readings of the mileage, engine hours, and GPRS traffic counters. |
| Parameters | The raw data received from the device. To view parameters in the mobile application, the Messages service is required. |
| Trailers | The trailers assigned to the unit. |
| Drivers | The drivers assigned to the unit. To the right of the driver’s name you can see the phone number specified in the driver’s properties. To call the driver, tap the number. |
| Altitude | The altitude above sea level. |
| Satellites | The number of satellites with which the connection is established. |
Customizing the “Info” tab view
You can hide the map or the information section. To do this, drag the unit information section up or down, respectively.
To select the sections you want to be displayed on the tab, tap Configure tab view at the end of the list and enable or disable the required sections using the switch. The indicated settings are applied to all the units at the same time.
Viewing sensor data
Unit details provide historical sensor data in an interactive chart format. This feature allows you to monitor equipment activity, analyze trends, and diagnose issues, like engine overheating or fuel drain.
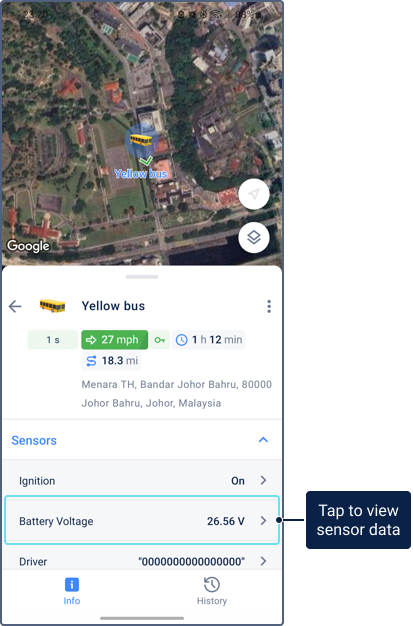
To access historical sensor data, navigate to the Info tab and tap the row of the required sensor. The data is displayed in a chart with the x-axis representing time and the y-axis representing the sensor value. The chart can display only numerical values.
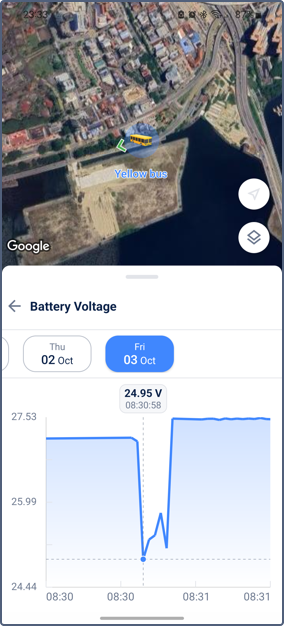
Once you’re viewing the chart, you can perform the following actions:
- Select a date: Tap a specific date to view the data for that day. If there is no data, the page displays No data.
- View exact values: Tap a point on the chart to see its precise value and timestamp. These values are displayed according to the filtering and rounding settings from the web version and include units of measurements if they are configured for the sensor.
- Zoom: Use a pinch gesture to zoom in or out on the chart.
- Navigate the chart: To navigate a zoomed chart, swipe left or right on the screen.
- Expand view: Drag the page border up or down to switch between a full-screen view and a split view showing both the map and the chart.