Tracks
A track is a line showing the unit movement on the map. The track is generated on the basis of unit messages with coordinates, without taking into account the Trip detector option.
Tracks allow you to see not only the location of the unit, but also its speed, sensor and parameter values at a certain moment of movement. Tracks can also show markers of various events that occurred with the unit.
On this page, you will find a description of the following actions:
- Generating a track
- Customizing the “Tracks” tab appearance
- Navigating a track
- Viewing information about tracks, sensor and parameter values
- Viewing events
- Using the “Area” tool
Generating tracks
On the Tracks tab you can generate only one unit track at a time. The track is colored depending on the speed of the unit.
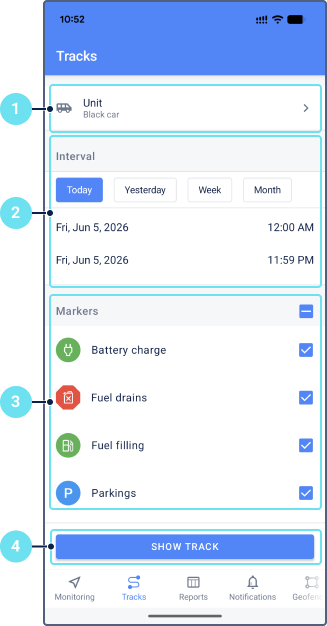
To generate a track, follow the steps below.
-
On the Tracks tab, select the unit the track of which you want to generate.
-
Specify the time interval for which you want to generate the track. There are two ways to do it:
- Use quick buttons to select a preset interval: Today, Yesterday, Week, Month.
- Tap the fields of the interval beginning and end to select custom date and time in the calendar.
-
Select the event markers you want to see on the track.
-
Tap Show track.
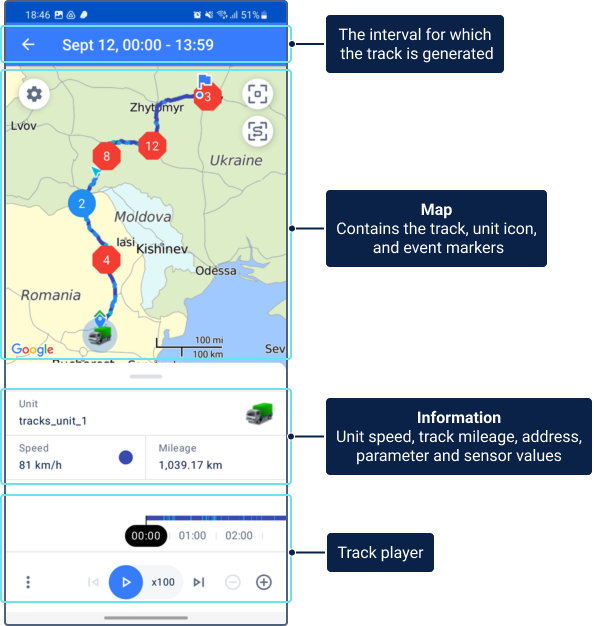
As a result, you will see a screen showing the track on the map, as well as an information section and the track player. See the description of this screen in the Customizing the “Tracks” tab appearance section.
The option to generate a track is also available from the unit menu.
Questions and answers
Customizing the “Tracks” tab appearance
When the track is generated, the Tracks tab consists of four parts:
- header showing the interval for which the track is generated
- map showing the track, unit icon, track start and end markers, and event markers
- information section: address, speed, total mileage over the track time, parameter and sensor values
- track player
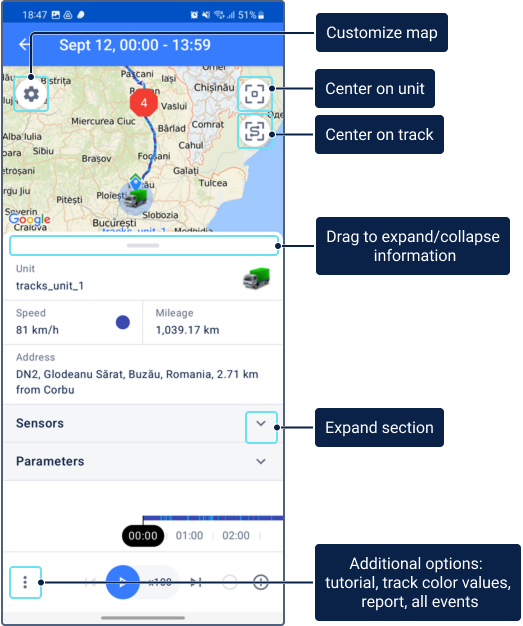
Use the following options to navigate the tab and customize its appearance:
| Option | Description |
|---|---|
 |
Show the unit in the center of the map. |
 |
Fit the entire track on a map. |
 |
Customize the appearance of the map. See Settings. |
 |
Additional options which include the following items:
|
You can also change the size of the track information section. To do this, drag its border up or down.
Track color
The track is colored depending on the unit speed at each segment. Speed intervals and their corresponding colors are configured on the Advanced tab of the unit propeties (see the Track color: By speed option) in the web version of the monitoring system. If in the web version the selected method of color determination is not by speed, the mobile application uses standard speed intervals and colors from the monitoring system.
To find out which color corresponds to each speed interval, tap the icon and select Legend.
Unit icon
The location of the unit is indicated on the map by its icon. To show motion state signs instead of the icon, disable the Unit icons option in the map settings.
The name of the unit is shown below the icon. To hide the unit name, turn off the Unit names option in the map settings.
For information about changing the unit name and icon, see the Actions with units from the unit menu page.
Navigating a track
You can move along the track to see where the unit was at a particular point in time and how speed, parameter and sensor values were changing.
You can navigate the track in two ways: automatic playback or manual navigaton to track points.
Automatic playback
To play the track automatically, tap the icon  in the track player. To select the playback speed, tap the icon of the type
  , where the number indicates the playback speed relative to real-time playback.
During playback, the unit icon moves along the track. At the same time, the values of sensors, parameters, speed, and the unit address change in the information section below the map.
During the track playback, use the track player options.
Navigation to track points
You can navigate to specific track points to see the exact unit location, speed, parameter and sensor values at a particular point in time.
To do this, swipe left or right on the timeline, or tap a track point on the map. You can use the track player options while doing this.
The unit also changes its location when you tap an event marker on the timeline: the event information opens and the unit icon moves to the location of the event on the track.
Track player options
The track player is located at the bottom of the Tracks tab. It consists of a timeline and options for navigating through the track. The timeline is colored in the same colors as the track (see Track color) and has the same event markers.
You can use the following options while navigating the track:
| Option | Description |
|---|---|
|
Start playback. |
 |
Stop playback. |
|
Change the playback speed. Five speeds are available: x1, x25, x100, x500, x1000. |
 |
Decrease the playback speed. |
 |
Increase the playback speed. |
 |
Go to the following event. Available when playback is stopped. |
 |
Go to the previous event. Available when playback is stopped. |
 |
Zoom out the timeline. The range of time segments is from 5 minutes to 1 hour. This option doesn’t affect the map scale. |
 |
Zoom in the timeline. The range of time segments is from 5 minutes to 1 hour. This option doesn’t affect the map scale. |
Viewing information about tracks, sensor and parameter values
To expand the section with track information, pull up on its border.
The data in the fields, except for the Unit and Mileage fields, corresponds to the track point where the unit icon is located. To learn how to move the unit icon along the track, see the Track navigation section.
Below is the description of data from the information section.
| Field | Description |
|---|---|
| Unit | The name of the unit for which you have generated the track. |
| Speed | The speed of the unit at a particular track point. The color that corresponds to this speed interval is shown next to it. |
| Mileage | The total mileage of the unit corresponding to its movement along the track.The mileage on the Tracks tab may differ from the mileage on the History tab. This occurs due to different data processing methods: for the History tab, data is processed in real time, while for the Tracks tab, as well as most reports in the web version, messages from the database are used upon request. In case of such discrepancies, the value on the History tab is more accurate. |
| Address | The address where the unit was at a particular point of the track. |
| Sensors | The values of the unit sensors at a particular point of the track. The same display rules are applied to these sensor values as on the Info tab in the Sensors section. |
| Parameters | The values of parameters at a particular point of the track. This field shows “raw” values, that is, as in the message from the unit, without applying transformations. |
Viewing events
Events are marked on the map and timeline with markers. To see information about an event, tap its marker on the map.
To see information about the event and move the unit icon to its location, tap the event marker on the timeline.
To see a list of all events that occurred while the unit was moving along the track, tap the icon and select All Events. The list shows only those types of events that were selected when generating the track.
If you tap an event in the list, this event is shown on the map and information about it is shown at the bottom of the screen.
Event types
Markers of different colors are used to indicate events. Red indicates alarm events (fuel drain, speeding), yellow represents registered events, green is used for fuel fillings and battery charges, and blue for parking events.
| Event marker | Description |
|---|---|
 |
Fuel drain. Determined by the fuel level sensor. The drain time is the time of the highest fuel level drop. Red color indicates an alarm event. |
 |
Speeding. Determined according to the settings on the Advanced tab. Red color means an alarm event. |
 |
Events registered as a result of triggered notifications with the Register event for unit action (created in Wialon web version). See the list of all possible events on the Unit history page. |
 |
Fuel filling. Determined by the fuel level sensor. The filling time is the time of the highest fuel level difference. |
 |
Battery charge. Determined by the battery level sensor. The charge time is the time of the highest battery level difference. |
 |
Vehicle parking. Determined according to the settings on the Trip detector tab. |
If several events occurred at the same time or are close to each other, they are grouped and their common marker shows the number of grouped events.
| Common marker | Description |
|---|---|
 |
A group of events in which at least one event is alarming. |
 |
A group of events which doesn’t include alarm events. |
The beginning and end of the track are indicated by the icons ![]() and
and ![]() , respectively.
, respectively.
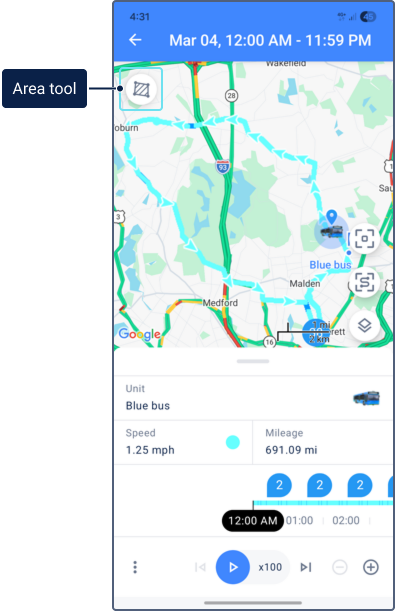
Using the “Area” tool
The Area tool helps you measure the area and perimeter of specific zones on the map. For example, it can be useful for measuring agricultural fields.
This tool works only online. Measurement results can’t be saved or downloaded. Make sure to record any measurements you need before closing the tool.
To open the tool, go to the Tracks tab, generate a track and tap the icon  in the upper-left corner.
Once the tool is active, use the following actions to draw and edit your shape:
- Add a point: Tap anywhere on the map to place the first point. Continue tapping to add more points and build a shape.
- Move a point: Tap a point, then long-tap the icon
 and drag it to adjust the point location.
 - View measurements: The calculated area and perimeter are displayed at the top of the screen. The values are updated in real time as you adjust the shape. The measurement system depends on the user settings from the web version.
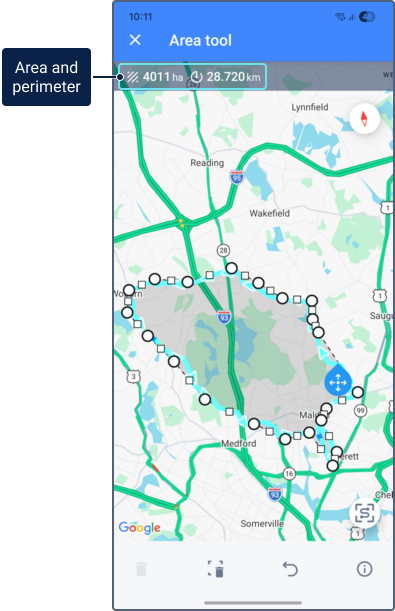
The toolbar at the bottom of the screen provides additional actions:
- Delete a point
 : Tap a point to select it, then press the button to remove it.
 - Start over
 : Clears the map and deletes the entire shape so you can begin a new measurement.
 - Undo
 : Reverts your last action while keeping all other changes.
 - Instructions
 : Displays in-app help on using the tool.