Unit history
The prerequisites for accessing the unit history are listed on the Monitoring page.
The History tab provides historical unit data, including trip details, parking intervals, fuel filling, consumption and drains, battery charges and consumption, and events registered after triggered notifications.
To access the unit history:
- Open the Monitoring tab in the navigation bar.
- Tap the required unit section.
- Select the History tab.
History tab overview
The History tab displays:
- Unit location on the map: The current unit location on the map based on the last message.
- Historical unit data: data on trips, parking intervals, fuel fillings, drains, and consumption, battery charges and consumption. In addition, the tab can display events registered by means of notifications.
To show the unit track on the map, tap the summary row for the day or a specific trip row. For details, see the Unit track on the map section.
From the History tab, you can also access the unit menu by tapping the icon  .
.
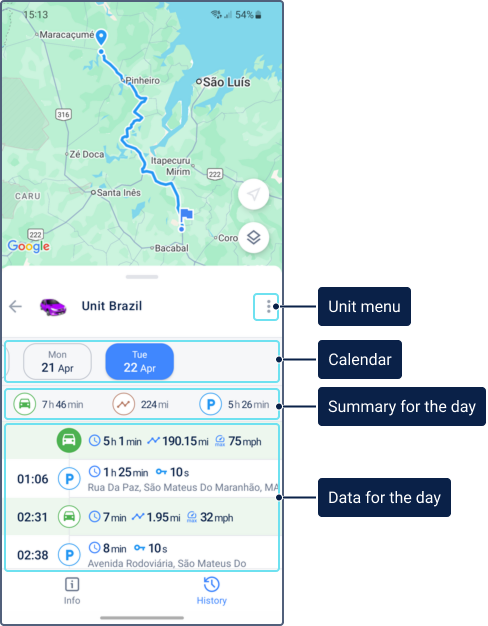
You can adjust the History tab layout. Expand either the unit history or the map by dragging the history section up or down.
Data generation for the “History” tab
The application uses data obtained as a result of message processing in real-time.
The history shows data for the last 300 days.
The data on the tab is presented in chronological order and is formed on the basis of the messages received in the last 24 hours. The data is not formed on the basis of the messages generated more than 24 hours ago (after they are unloaded from the black box).
Day selection
By default, the data is displayed for the current day. You can get the data for another day in one of the ways described below.
- Select the required day in the calendar.
- Swipe down or up to add the previous or next day to the list. If necessary, repeat the action to add more days.
Summary information for the day
The top row shows summary information for the day. Tapping this row shows or hides the full-day track on the map.
The summary row includes the following data:
 Trip duration
 Track length in trips
 Parking duration
 Total fuel consumption in trips if there is a fuel level sensor
 Average fuel consumption per 100 km or mi in trips if there is a fuel level sensor
 Total battery consumption if there is a battery level sensor
 Average battery consumption per 100 km or mi in trips if there is a battery level sensor
Particularities of the fuel and battery data calculation
- Fuel and battery data are calculated according to those sensors in the properties of which the Calculate data by the sensor option is enabled in the web version of Wialon. If the option is enabled in the properties of several sensors of one type, their readings are summed up.
- When a trip starts on one day and ends on the next, all the fuel consumed during such a trip is attributed proportionally to both the first and second day at the same time.
Particularities of mileage calculation
- When detecting trips, the Wialon mobile application uses the trip detection settings.
- When a trip starts on one day and ends on the next, its mileage is split into two parts. The first part is added to the summary total for the first day, and the second part is added to the summary total for the next day. This rule applies only to the daily summary (top row). See the Detailed data for the day section for how individual trip data is displayed.
The trip mileage on the History tab may differ from the mileage on the Tracks tab and the Wialon web version. This can occur due to the rounding of values in the mobile app and different data processing methods: for the History tab, data is processed in real time, while for the Tracks tab and most reports in the web version, messages from the database are used upon request. In case of such discrepancies, the value on the History tab is more accurate.
Detailed data for the day
Below is the information displayed for each type of data. To see the place that corresponds to them on the map, tap the required line in the list. The icon in the selected line is displayed in a contrasting color. For example, the icon of a fuel filling changes from  to
to  .
.
When a trip starts on one day and ends on the next, that trip row is displayed on both the first and second days. Its data, such as mileage, fuel, and duration, is not split and is shown in full. See the Summary information for a day section to learn how the summary total values are calculated in this case.
| Icon | Type of data | Available information |
|---|---|---|
|
Trip | General information
Speeding details
Fuel and battery consumption
The amount of fuel consumed during the trip is determined by the fuel level sensor (FLS); the amount of consumed energy, by the battery level sensor. If there are several sensors of one type, the sum of their values is displayed. The amount of fuel in the application may differ slightly from the resulting data in the reports executed in the web version of Wialon. This can be caused by the following reasons:
For details on viewing trip tracks on the map and opening them on the Tracks tab, see the Unit track on the map section. |
|
Parking |
|
 |
Ignition |
This information is displayed if the unit has had the ignition on according to the sensor, but no trip has been detected. The information about ignition is available if the unit has an ignition sensor. |
|
Fuel filling |
|
 |
Fuel drain |
If fillings and drains are marked as false in the monitoring system, they are excluded from the history. |
 |
Battery charge |
|
 Duration
 Maximum vehicle speed
 Indicates that the vehicle exceeded the speed limit.
 Speed limit. Determined by road limits or a custom value depending on the
  Violation duration
 Speed at the time of the maximum speeding, that is, at the moment of the greatest difference between the permitted and actual speed. May differ from the maximum speed.
 Difference between the permitted and actual speed at the moment of the maximum speeding
 Fuel consumed during the trip: its amount (
 ) for U.S. and imperial
  Battery energy consumed during the trip: its amount (
 Parking time with the ignition on
Unit track on the map
To show the full-day track covering all trips on the map, tap the summary row for the day.
To see the track for a specific trip, tap the trip row in the detailed data list.
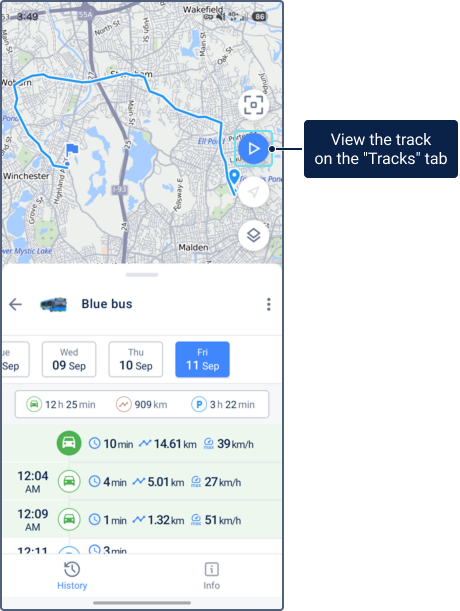
To open the track on the Tracks tab for playback and viewing events, tap the icon  . The app navigates to the Tracks tab with the time period preselected: the full day if the summary row is selected, or the trip period if a specific trip is selected.
Registered events
The History tab can display all events registered by means of notifications with the Register event for unit action. To enable this, activate the Events from notifications in unit history switch in the Notifications section of the settings. You can create and configure such notifications only in the web version of Wialon. See more about the notification notification types.
Event types and icons
Depending on the notification type, the registered events are indicated by the following icons:
| Icon | Event |
|---|---|
 |
Speed |
 |
Alarm (SOS) |
 |
Parameter in a message |
 |
Connection loss |
 |
SMS |
 |
Address |
 |
Fuel filling or battery charge |
 |
Route progress |
 |
Trailer |
 |
Passenger alarm |
 |
Geofence |
 |
Digital input |
 |
Sensor value |
 |
Idling |
 |
Interposition of units |
 |
Excess of messages |
 |
Fuel drain |
 |
Driver |
 |
Passenger activity |
 |
Maintenance |
Viewing events
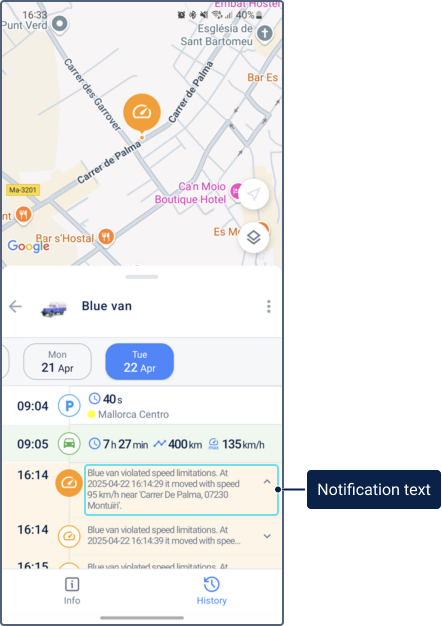
To see an event on the map, tap the required line in the list. The icon in the selected line is displayed in a contrasting color. For example, the icon of the event for the Speed notification type changes from to  . If the event is registered by means of a notification, the event information displays the notification text.
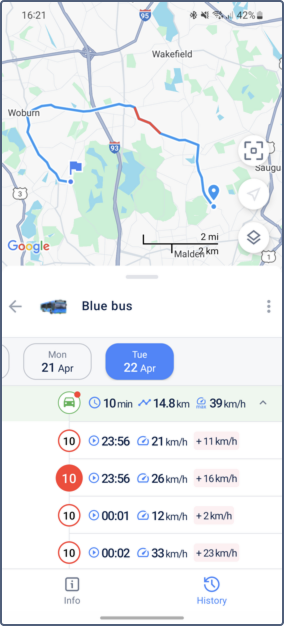
The icons  and
and  are used to indicate the beginning and end of the trip, respectively. The segments of the track where speeding was detected are coloured in red.