Analyzing trips
After carrying out the calculation and receiving the driving quality assessment, you can go to the detailed analysis of the assessment by clicking on the line of the unit in the statistics table. The tab with the detailed information has the following interface: trips are displayed at the top of the screen, the map is displayed below to the right, the violations table is displayed to the left of the map.
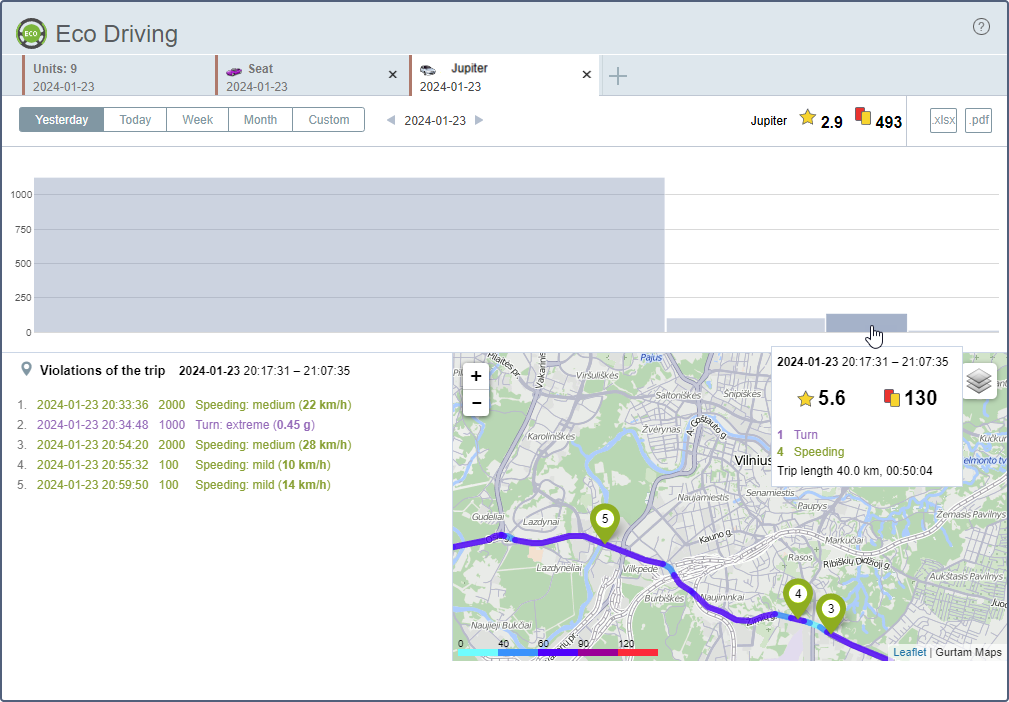
Trips are displayed as bars. The width of the bar is the ratio of the duration of the first trip to the time of all the trips in the indicated interval. The height of the bar shows the number of penalty points. The minimum and maximum penalty value on the indicated interval are viewed in the scale to the left. When you point to the trip bar, a tooltip with the following information appears:
- date of the trip
- time interval
- mileage
- duration
- number of penalty points
- rank
- number of violations in the trip
- types of violations in the trip
To center the map on the trip track, click on the trip bar. Trip tracks are colored depending on the unit speed. The scale which indicates the speed and the corresponding color is displayed in the bottom left corner of the map. Violations on the track are highlighted with markers.
Gurtam Maps is used as a map source. You can scale the map using the +/− buttons in the upper-left corner or using mouse scroll.
The list of violations marked during the trip is displayed on the left of the map. The list is presented as a table and includes the following data:
- trip date
- trip duration
- type of violation
- value of penalty points
- value of violation
If you click on the marker of the violation on the map, the line with this violation is highlighted on the list.