Map Output
The lines of the online report, which contain information about the location of the unit at the time of an event, are highlighted in blue. If you click on the line with the left mouse button, the message is marked on the map with a special marker, and the map, in turn, is centered on its location.
You can select special markers in the form of small icons which can be put in the places of parking and stops.
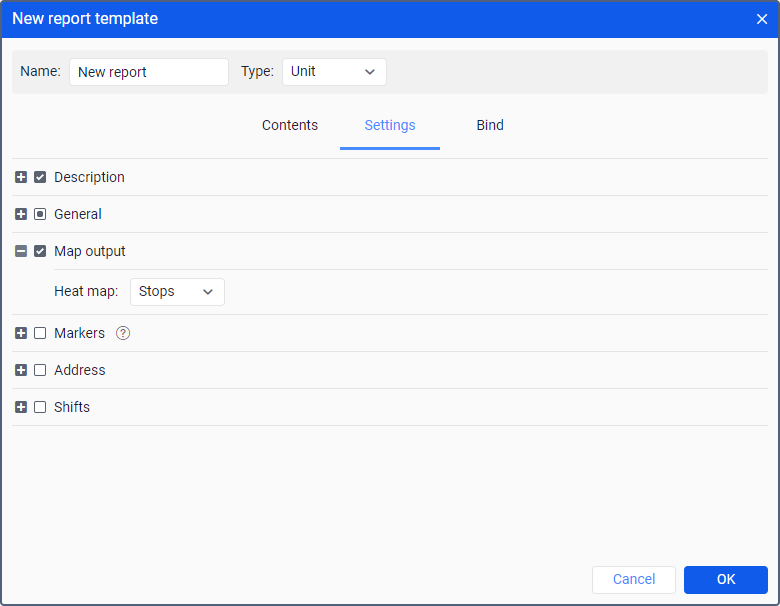
Some data can also be displayed in the form of a heat map. Its colour varies from blue (minimum) to red (maximum) depending on the amount of data. In the drop-down list of the Heat map field, select one of the options:
- disabled;
- parkings;
- stops.
All graphical elements are shown for the current report. If generating a new report, all markers from the previous report are erased and replaced by new. When switching to other panels, all graphical elements from the current online report, as well as a map position and zoom remain on the map. To remove them, return to the Reports panel and click on the Clear button. Alternatively, the graphics of any panel can be hidden or displayed again. To do this, select the corresponding options in the horizontal menu. More information about using map with different panels can be found here.