Preparing Data
Ellipsis (…) substitutes Unit properties → Sensors → FLS properties when indicating the option paths.
Among the important options, the next list should be mentioned:
- Option: Ignore the messages after the start of motion;
- Special case: Mileage-based calculation VS Time-based calculation.
Ignore the messages after the start of motion
... → General settings → 'Ignore the messages after the start of motion, sec'
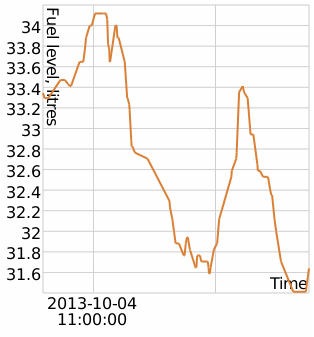
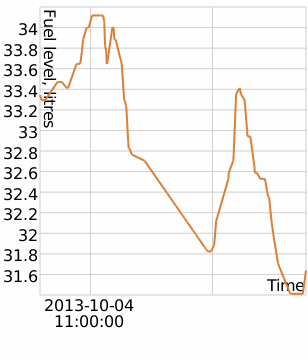
This option allows you to exclude messages after starting the movement within the designated time interval in seconds. Cross-border messages with an ignored interval are connected by a line.
Here is the whole algorithm:
- A start motion message is taken and is used to define the number of messages being ignored.
- This message is regarded as a left-frontier message.
- Then we add seconds set in the option to this message timestamp to get the end moment of the ignored time period.
- All FLS messages which got in this time period are ignored while processing.
- The first message that comes after the ignored period (p.3), is called a right-frontier message.
- Both left- and right-frontier messages are joined by the line being drawn (instead of taking the ignored messages into account while building the chart).
All the processed charts have the option for such correction (except for the Regular charts, where the data is raw).
This is the chart with no ignoring:

The chart with the ignore option turned on:

Mileage-based calculation vs time-based calculation
... → Filling settings → 'Time-based calculation of fillings'
... → Theft settings → 'Time-based calculation of thefts'
... → General settings  → 'Calculate fuel consumption by sensor' → 'Time-based calculation of fuel consumption'
The convergence of the data (i.e., when the sum of interval results equals the whole interval result) is guaranteed when all the mentioned options are activated/deactivated:
- Time-based calculation of fillings;
- Time-based calculation of thefts;
- Time-based calculation of fuel consumption.
While Time-based calculation (all three options) is switched on the x-axis is time:
- fuel consumption/idling looks like a slowly descending curve on the graph;
- thefts/fillings — a quick falling in the fuel level for a short period of time (theft/filling processing time).
While Time-based calculation is switched off (the data is calculated as mileage-based) the x-axis is mileage:
- fuel consumption in motion looks like a slowly descending curve;
- idling is marked as a vertical falling of fuel level;
- thefts/fillings on stops are marked as a vertical rising of fuel level.