Reports on Unit Groups
Data from several units can be gathered in one report if these units are from a unit group. To get a report on several units, select the Unit group type for the report template.
The functionality of these reports is very similar to reports on separate units but has a number of peculiarities and restrictions.
In the Unit group reports the following features are available:
- same tables as for unit groups;
- markers on the map;
- some graphs in the statistics: Report, Group, Interval beginning, Interval end, Report execution time;
- advanced options: U.S. measurement units, address format, etc.
Charts are not available in the Unit group reports.
If you add a column with a custom sensor value (Avg value of custom sensor, Min value of custom sensor, Max value of custom sensor, Initial value of custom sensor, Final value of custom sensor) to a report on a unit group, then you should specify the full name of the required sensor in the Custom sensor name filter. Otherwise, you cannot save the report template.
Tables for unit groups
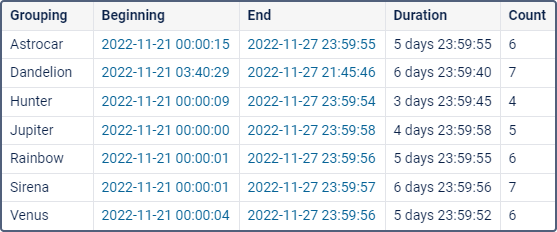
There are some peculiarities in configuring tables for unit groups. The first column of the table shows the list of all units included into a selected group (in alphabetical order). This column is put in front of all the other ones indicated in a template. The Count column (if included in the report template) shows the number of events registered for the reporting period of a given unit.
Below is an example of a table on parkings for a group of 5 units. The table provides us with the following data: the beginning of the first parking, the end of the last parking, the summarized duration of all parkings for the reported period. Every line is dedicated to a single unit.
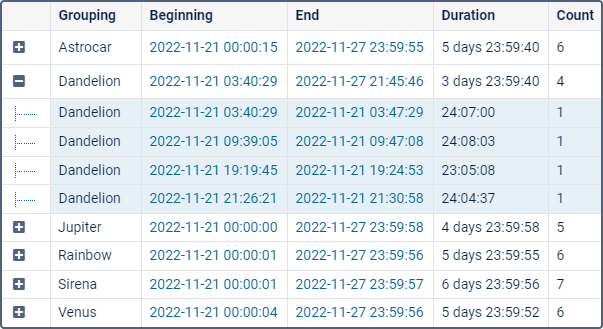
If the option of detalization is applied, the nesting level appears. This means that you can expand the contents of a basic line (‘+’ at the beginning of a line, or the corresponding number in the heading of the column) and see the detailed list of events for a given unit. The number of hidden lines corresponds to the number in the Count column.
In addition to detalization, you can apply the grouping by years/months/weeks/days/shifts. In this case, the table data is grouped by a selected time interval. If several grouping intervals are chosen, they are arranged in several levels of nesting. If grouping is set, detalization can be found on the final level of nesting, and it still shows a detailed list of events for a given unit.
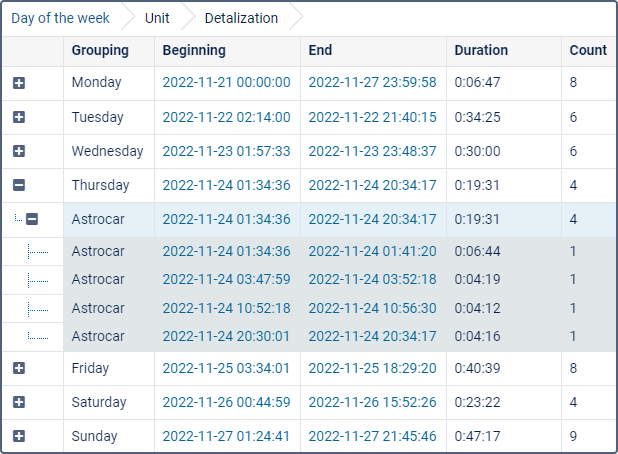
To expand the enclosed information, click on the plus-shaped button at the beginning of each line. It is also possible to expand the nested levels by clicking the corresponding numbers-buttons in the heading of the nesting column. To hide all the expanded lines, click on the button ‘1’.
If there is no data for the given unit, all the cells (except for the name) contain only dashes. In some cases it is not convenient, so you can disable such uninformative lines. To do this, enable the Skip empty rows option in the report template.