Report Templates
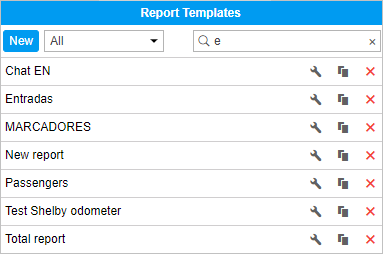
A report can only be generated on the basis of a previously created template. A list of all available templates is located in the lower left part of the window under the Report Templates header. Here you can create, edit and delete templates for reports, as well as copy and move them from one account to another.

The template contains information about which tables and charts will be included in the report, what kind of content will be presented in the tables, the order of the columns in tables and sections in the report, which graphical elements will be rendered on the map, and many other parameters which define the look of the resulting report.
When you hover the cursor over the name of a template, the tooltip displays its name, the name of the resource to which it belongs (if you have access to more than one), the type of the report, the list of tables and charts that it contains, the list of the bound objects, and description. When you click on a template, it becomes selected in the Template field.
The templates in the list are arranged in alphabetical order. When searching for a template, it is convenient to use the dynamic filter. Enter the name of the report or its part into the search field. Additional search parameters are set in the drop-down list, where you can select a particular resource or leave All.
The following actions are available:
 or
or  — edit or view a report template (depends on your access level);
 — create a new template using the selected one as the basis;
 — delete a template (if the button is dimmed, you do not have enough rights).
If a template belongs to the resource to which you do not have the Create, edit, and delete report templates access right, you will not be able to edit or delete this template.
Creating a report template
To manipulate the report templates, the user should have the Create, edit, and delete report templates access right to at least one resource.
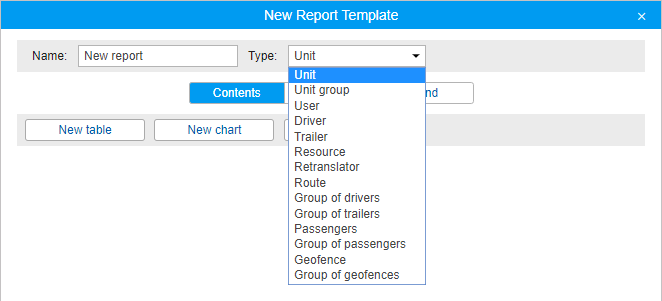
To create a new report template, press the New button. If you have access to more than one resource, select the required one and click Next.
At the top of the report template creation window, you must specify its name and select the type.

The following types are available.
Unit — the template is used to analyze the data from any single unit.
Unit group — the template is used to analyze the data from several units simultaneously.
User — the template is used to analyze the activity of users.
Driver — the template is used to analyze the work of drivers.
Trailer — the template is used to analyze the use of trailers.
Resource — the template is used to track the changes in the contents of the resource.
Retranslator — the template is used to analyze the work of retranslators.
Route — the template is used to analyze the passing of routes.
Group of drivers — the template is used to analyze the work of several drivers at the same time.
Group of trailers — the template is used to analyze the operation of several trailers simultaneously.
Passengers — the template is used to analyze passenger traffic.
Group of passengers — the template is used to analyze the traffic of the groups of passengers.
Geofence — the template is used to analyze which units have visited a geofence.
Group of geofences — the template is used to analyze which units have visited a group of geofences.
It is not recommended to change the report type later, because when you change the type, all the contents and settings of the template are lost.
Below are the Report Contents, Settings and Bind tabs, on each of which the properties of the future report template are configured.
A list of the content added to the report template is shown below. To rename a component, click on it with the left mouse button and make the necessary changes. The following buttons are available for working with the content list:
 — drag the component up/down;
 — edit the properties of the table/chart;
 — copy the table/chart;
 — delete the component.
Regardless of where the chart is located in the report template, in the list of results of the executed report, all the charts are located under all tables, and the statistics data occupy the top lines.