Dashboard
The Dashboard contains summary information about the units from the work list. Here you can quickly assess the connection and motion state of the units, see the latest online notifications as well as the geofences where the units are located, and so on. The information is updated as new messages are received from the units.
The Dashboard is available to the users if the Dashboard service is activated in their billing plan or account properties in CMS Manager.
To open this page, click on the Dashboard button at the top of the work area on the Monitoring tab. If the work list on the tab contains 100 or more units, the Dashboard opens automatically when you log in.
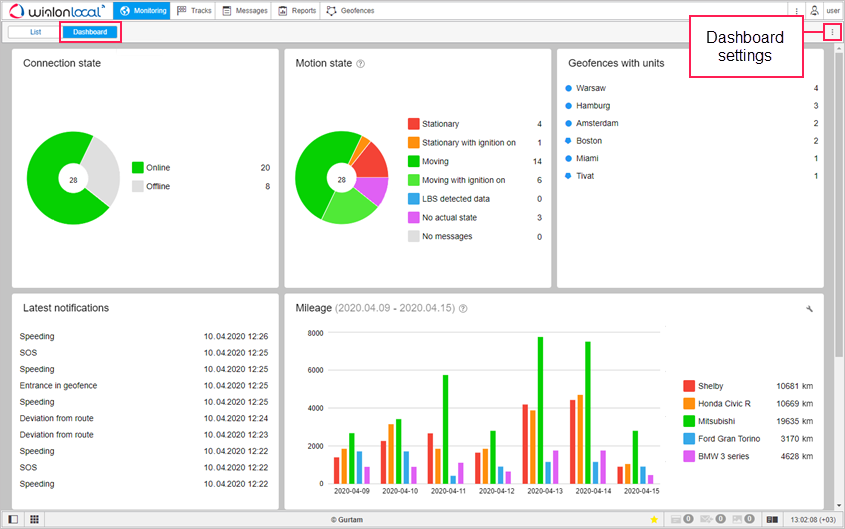
Seven information blocks are available on the page. In the Dashboard settings ( ), you can select the blocks which should be displayed and change their order by dragging the arrows.
Connection state
This block contains a pie chart with information about the connection state of the units: online or offline. To the right of the chart is its legend, which shows what category is represented by each colour and how many units belong to it. When you point to a sector of the chart, a percentage of units belonging to this category is displayed.
To see the list of units belonging to the category, click on it in the legend.
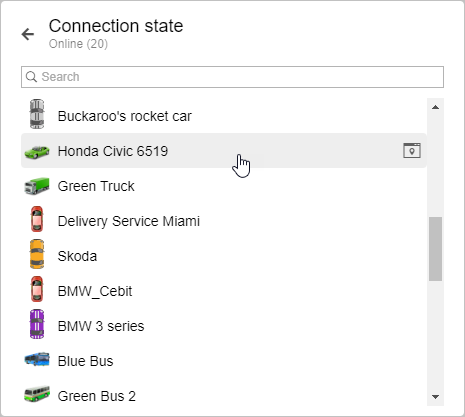
To quickly find units by name, use the dynamic search above the list. Click on the line with the unit to open its minimap.
Motion state
This block contains a pie chart with the information about the motion state of units. The chart legend shows what category is represented by each colour and how many units belong to it. When you point to a sector of the chart, a percentage of units belonging to this category is displayed.
To see the list of units belonging to the category, click on it in the legend. Above the list is a dynamic search to find units by name. Click on the line with the unit to open its minimap.
Geofences with units
The block is displayed if the Presence in geofences option is activated in the User settings. It shows a list of geofences where the units are located at the moment. The following information is indicated for each geofence: type (graphically), name and the number of units.
Click on the geofence name to see the list of all the units located in it. Above the list is a dynamic search to find units by name. Click on the line with the unit to open its minimap.
Latest notifications
The block shows the latest online notifications as well as the date and time they were received. To open a notification, click on its name.
Mileage
This block contains a graph with the data on the mileage of units over the past seven days. The graph legend shows the mileage of the unit and the colour that corresponds to it. When you point to the part of the graph corresponding to one day, you can see a tooltip with the data on the unit mileage for that day.
You can change the list of units which are represented in the graph. To do this, click on the icon  and select the required ones. (no more than 5). To quickly find units, use the dynamic search. Then click on the icon
 ![]() to go to the graph.
to go to the graph.
Fuel consumed by FLS
The graph of this block displays how much fuel was consumed by units and detected by the fuel level sensor (FLS) over the past seven days. The graph legend shows the volume of fuel consumed by the unit and the colour that corresponds to it. If the unit has more than one FLS, the sum of their values is indicated. To see how much fuel was consumed by the units on a certain day, point to the part of the graph corresponding to this day.
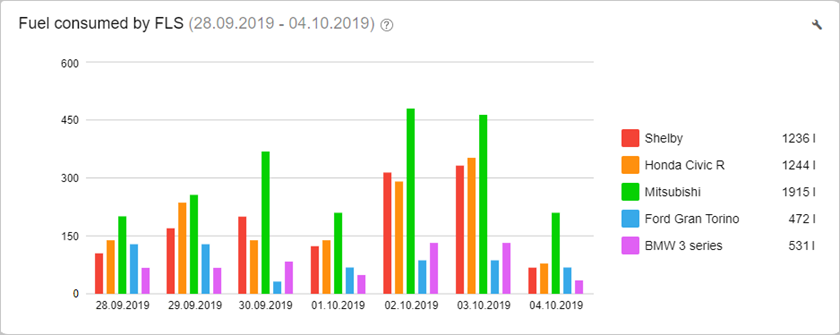
You can change the list of units which are represented in the graph. To do this, click on the icon and select the required ones. (no more than 5). To quickly find units, use the dynamic search. Then click on the icon ![]() to go to the graph.
to go to the graph.
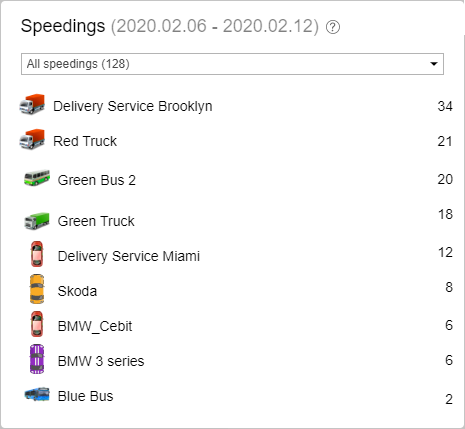
Speedings
This block contains the list of units for which speed limit violations have been detected. Opposite the name of the unit, by default, the number of all its violations is shown. To filter them, select the necessary range of values in the drop-down list in the upper part of the block. For example, you can display the number of violations where the speed limit was exceeded by 10 to 20 km/h.
The violations of the unit are shown in the block if the Use limits from roads method of speeding detection is selected on the Advanced tab of the unit properties.