Log
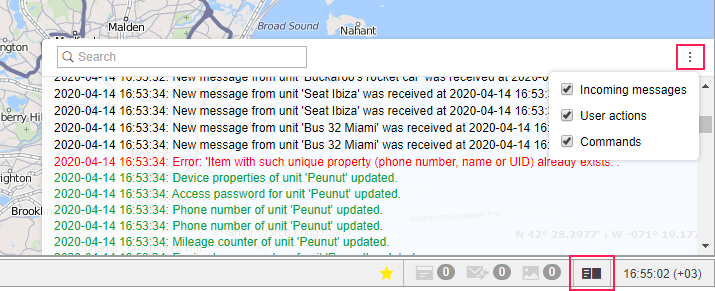
In the lower right corner of the screen, there is a log that opens by clicking on the icon in the bottom panel. The log displays information about user actions, commands execution, and receiving messages from the units included in the work list of the monitoring panel.
You can adjust the size of the log by dragging its border or corner. At the top of the log, there is a dynamic search, and in the upper right corner, there is a log settings icon ( ). In the settings, you can filter messages by type.
An arrow is displayed at the end of the lines for which unit location data are available. Click on the arrow to see the place of the event on the map.
Different colors are used to display text in the log:
- black is used for records of the actions of the unit, a change of location, a new SMS from the unit, etc.;
- green is used for records of user actions (creating and editing units, geofences, changing settings, etc.);
- red is used for error messages and alarm messages from the unit.
When messages are sent from the black box or retransmitted, only those that have been generated not earlier than one hour before the last positional message are logged.