Charts
In addition to the tabular form, some information in the report can be presented in the form of a chart. For example, a chart may reflect a change in fuel level or speed at a given time interval, the parameters of sensors, etc.
To create a chart, the corresponding equipment must be installed and configured on the unit (this does not concern charts for speed and altitude). To create and configure sensors, see the Units → Sensors section.
To add a chart to the report template, click on the New Chart button on the Report Contents tab of its properties.
Charts can only be added to reports of the Unit and User type.
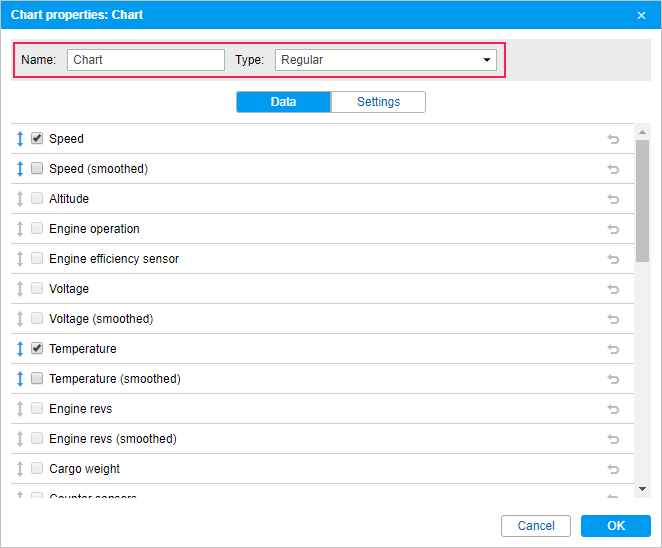
In the dialog for creating a new chart, specify its name and select the type.

Below are the Data and Settings tabs where you can specify the parameters of the chart.