Working with Charts
You can scale and move the charts as well as view the information about individual points.
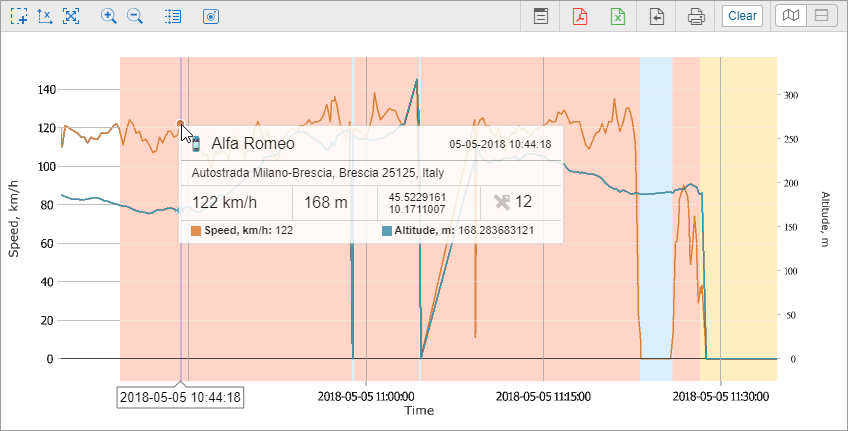
The line of the chart can be dashed at the segments where the interval between messages is greater than the value specified in the Maximum interval between messages parameter.
Above the chart, there is a toolkit with useful buttons:
| Click on this button to scale (zoom in) any selected area. Hold the left mouse button and select the required area. This operation can be repeated multiple times. |
| Switching from work with a single axis (X) to multiple axes (XY). |
| Return to the original scale of the chart. |
| The buttons change the scale of the chart by fifty per cent with respect to the visible zone. The center of the chart remains fixed. |
| Switching between these modes makes it possible to look through the information on one chart or on all available ones by hovering the cursor. Sensor values in the tooltip are calculated on the basis of one message. If a sensor or its validator uses data from the previous message, the value of this sensor will be displayed incorrectly in the tooltip. |
| The button allows you to save the visible area of the chart along with the coordinate axes in PNG format. |
| This button is displayed in the Dual report view mode. Activating this button allows applying the same actions to the charts simultaneously. |


If the X-axis shows time, you can click any place of the chart to move to the corresponding location on the map.
Transfer from chart to messages
This function is useful for analyzing the source data from the unit. In order to request messages from the unit from the chart, click on the Transfer to messages button ( ) located on the right side of the toolbar. Click the left mouse button anywhere in the chart. As a result, you will go to the message panel with open data for the period specified in the report. Other functionality works in the same way as a transfer from tabular report to messages.
When switching between charts, the state of the button automatically changes to the original one.
The rest of the buttons work the same as in the table reports.
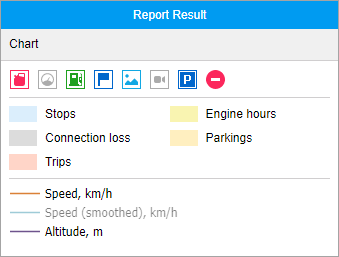
Chart legend
A chart legend can be found in the work area. The legend is divided into sections and contains information about the selected charts and their properties. Click on the name of the element in the legend to enable or disable its display in the chart (by default, all are displayed).