Data Messages
If you request messages with data, the table of messages will contain information about the message time, speed, coordinates, location, and available parameters. In addition, in the Statistics section, you can find summary information. There you will see the number of messages found upon request, the time from the first to the last message, the distance traveled, the average and the maximum speed. The mileage in messages in some cases may differ from the mileage in the reports (if there are invalid data on the interval). In such cases, the mileage in the reports should be considered more accurate.
There are two ways to display the parameters.
| Option | Result |
|---|---|
| Raw data | All the parameters are displayed in one line in the corresponding column. |
| Sensor values | Each sensor has its individual column in the table, and the values are given according to the calculation table. By default, only visible sensors are displayed, but you can enable other sensors manually (see Viewing messages). |
The table of messages has the following columns.
| Column | Description |
|---|---|
| Time | The date and time of the message. |
| Registration time | The date and time when the message was received on the server (disabled by default). |
| Speed | The speed of movement of the unit according to the message. |
| Coordinates | The latitude and longitude of the position of the unit and the number of the locked satellites (indicated in parentheses). |
| Altitude | Sea level elevation. If only zeros are shown, it means the device does not transmit altitude. |
| Location | The address of the unit when sending the message. |
| Parameters (if available) | The values of the parameters of all available sensors. The messages can be filtered by parameters. Instead of one column with parameters, columns with sensors can be displayed (if sensors values is selected). |
| Media | If there is an image or video sent by the unit, in this column you can find the button for viewing the media file. Click Save as in the lower left corner of the image file viewer to save it. |
| Delete | Check boxes to delete messages. Select the messages you want to delete and click on the button |

The following messages are highlighted in the table:
- alarm messages,
- messages with the location determined by LBS,
- imported messages,
- black box messages.
The information on each color and the message that corresponds to it is located in the Legend section.
Statistics
The Statistics section provides general information about the request.
| Column | Description |
|---|---|
| Total messages | The number of messages for the whole period. |
| Total time | The interval between the first and the last message of the selected period. |
| Distance | The distance travelled by the unit within the indicated time interval. Mileage in messages in most cases differs from mileage in reports (if there are invalid messages within the interval). In such cases, more accurate information is provided in reports. |
| Average speed | The average of all speed values registered during the period. |
| Maximum speed | The maximum speed registered. |
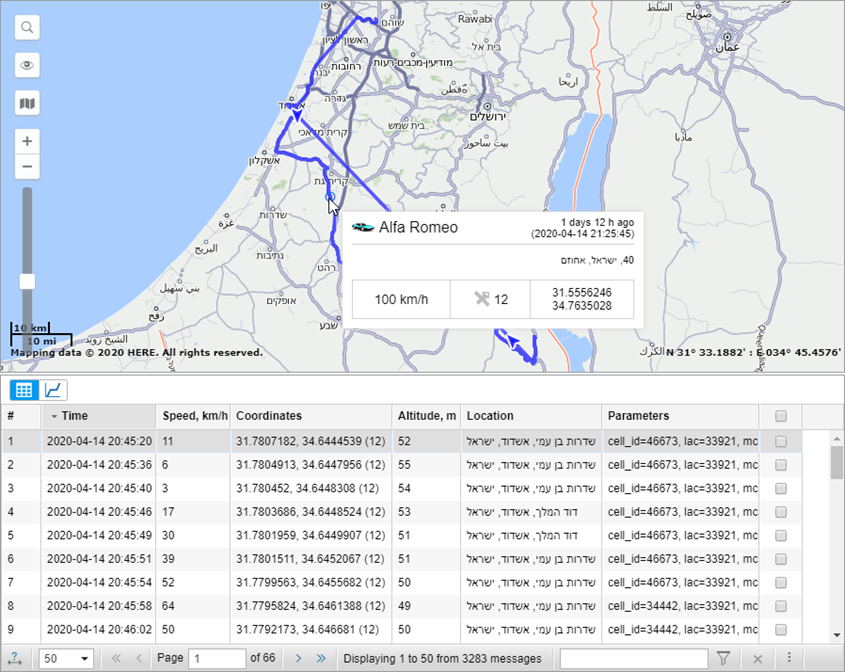
Using the map
The track for the selected period is displayed on the map.

It is generated together with the table. Select the message and click on it. The message will be highlighted in gray, the map will be centered on this point and a blue marker will be set there.
By default, the track is blue, but you can adjust the settings to color the track in accordance with the speed or sensor value. This can be set in the unit properties dialog on the Advanced tab.
When you hover the mouse cursor over the track, the nearest message is searched. If such a message is found within a radius of 50 pixels, the point of receiving the message is highlighted by a pulsating circle, and detailed information is displayed in the pop-up window: the time the message was received, the speed of the unit’s movement at that point, altitude, coordinates, number of satellites, readings of sensors.
If after the Messages panel you switch to other panels, the map layout, as well as all the track lines, is saved. To remove unnecessary graphics, go back to the Messages panel and press Clear. More information on how to use the map while working with different panels can be found here.
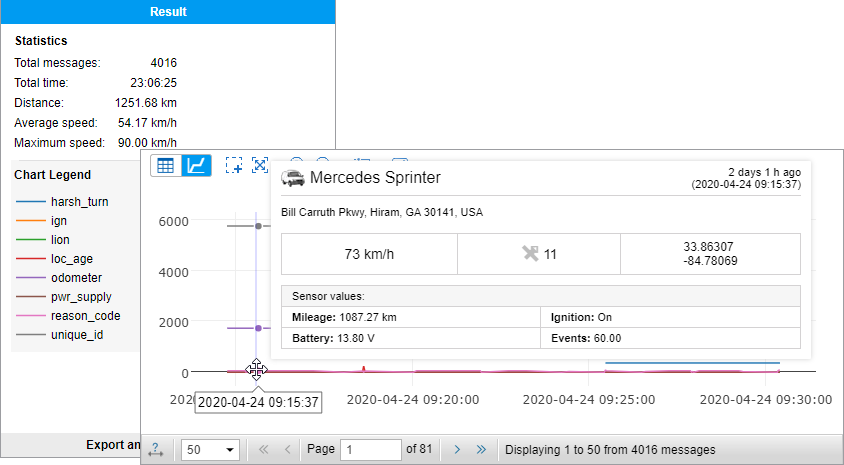
Charts
Besides the table view, some data can be presented in the graphical form. To switch between the modes, use the buttons  and
and  , correspondingly.
Go to the graphical mode to view the graphs of the parameters contained in the messages. The Chart Legend section opens in the work area to the left. Here, select the parameters you want to be displayed. You can check several parameters simultaneously — in such a case the graph contains more than one curve. For convenience, these curves are highlighted in different colors.
In the place of the table with messages, a graph appears, which can be scaled with the mouse. To do this, select the required fragment by holding the left mouse button. Hover over the key points on the graph to view their values. Use blue arrows in the navigation panel to move between the pages of the chart.