Reports
To switch to the Reports tab, click on the Reports header in the top panel and select the same name item in the main menu customizer.
Reports on the activity of a unit can be presented in the form of tables and graphs. They can be viewed in a browser window, as well as exported to files of various formats.

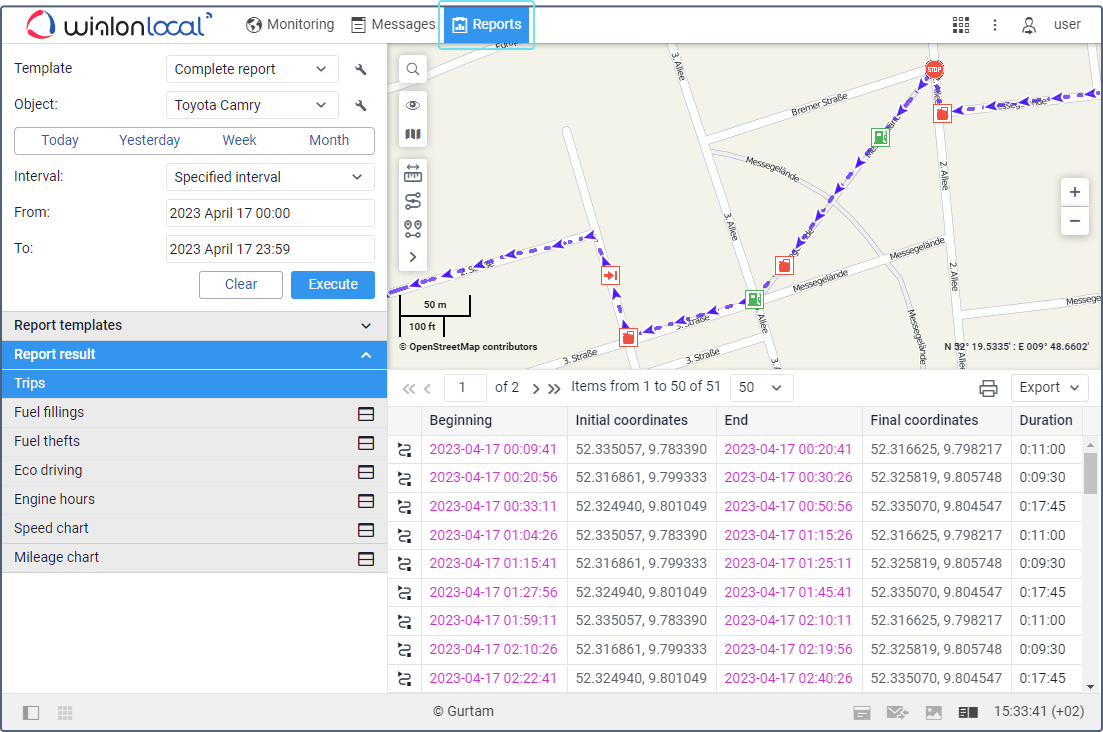
The Reports tab can be divided into four sections:
- in the upper left corner, the report parameters are adjusted;
- in the lower left corner there are report templates. After a report is generated, this section changes to the navigation bar;
- in the upper right section, there is the map (or another chart or table);
- in the lower right section, you see the report itself (tables, charts, images).
The sectors can be resized (the left ones — in width, the right ones — both in width and height). To do this, click on the border between them with the left mouse button and while holding it, move the border to the right/left or up/down. At the same time, if less than 10% of the map is left while expanding the lower sector, the map automatically collapses. To expand it, press the line under the top panel.