Calculation Table
The calculation table is available on the same-name tab in the properties of each sensor and is designed to convert data received in the specified parameter into sensor values. For example, an abstract parameter value 86 can be converted into 10,5 litres of fuel.
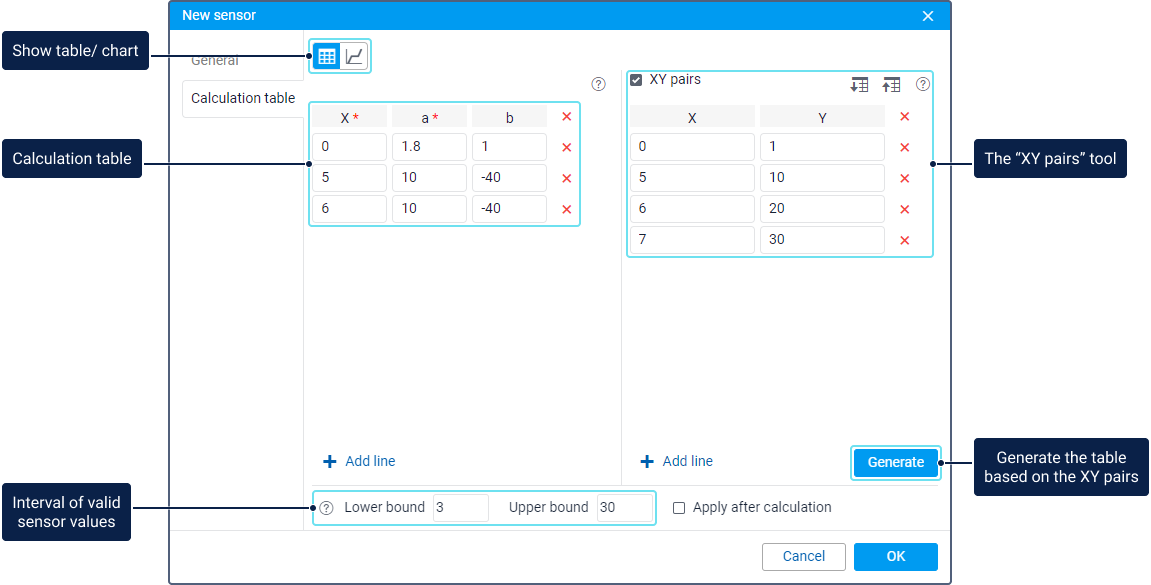
The tab is divided into two parts: on the right, you can see the XY pairs tool, and on the left, the calculation table consisting of columns with values X, a, and b. If necessary, you can see the calculation result in the chart.
Using the table
You can use the calculation table for the sensors of the following types:
- fuel level sensors and weight sensors when calibrating fuel tanks;
- temperature sensors the parameters of which send only positive values;
- analogue engine ignition sensors to determine the principle according to which all possible analogue values should be converted into two possible states: On/Off;
- sensors which use one parameter to send different codes indicating different events;
- any sensors in which the interval of valid and invalid values should be determined.
The received values shouldn’t be always converted. For example, if a digital sensor sends only values 1 and 0 corresponding to the On and Off states, the calculation table is not required.
See the examples of configuring the calculation table for sensors of different types in the guide.
Calculating values
The calculation table allows recalculating the received data according to the equation of the straight line Y = a × X + b, where:
- X is an input value which is received from the device;
- Y is an output value which should be used in reports, charts, additional unit information, and so on;
- a is a coefficient which determines the slope of the line (the tangent of the angle, or the relation of the opposite cathetus to the adjoining one);
- b is coefficient which determines the displacement of the straight line along the Y-axis.
After receiving the input value X, it is substituted in the calculation table. The coefficient a and the displacement b are calculated automatically, after which the final value Y is obtained.
The values X cannot be repeated because each line in the table operates only within its interval, that is, to the value X in the next line.
You can also get the tangent of the angle by mathematical calculations and substitute it into the coefficient a. To do this, you should find deltas (∆) on the X- and Y-axes, that is, the value validity intervals (from Х****1 to Х****2, from Х****2 to Х****3, etc.) and divide these values ∆Y / ∆X.
Working with the table
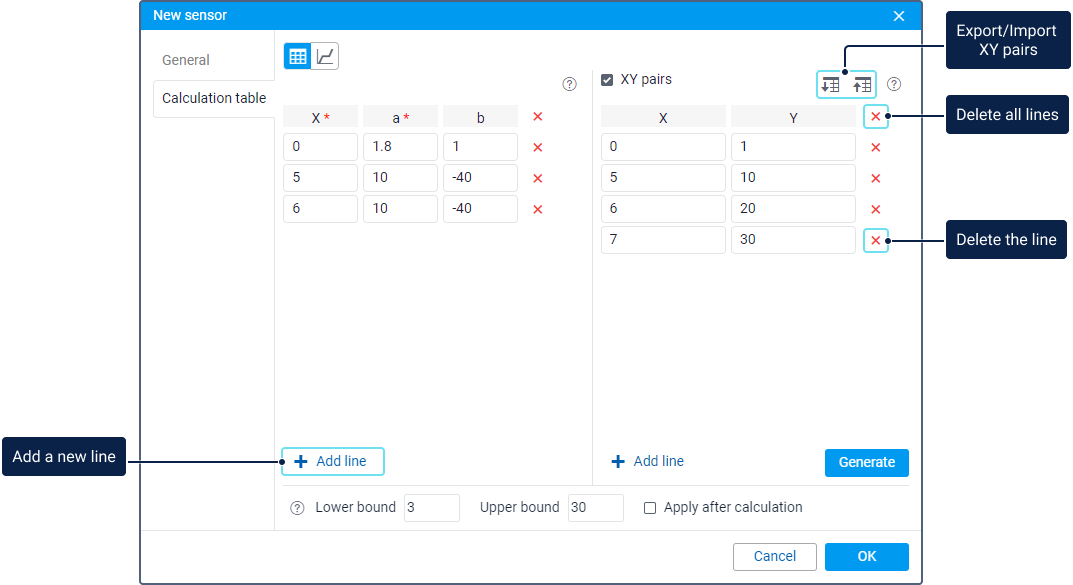
To add a new line to the table, click Add line ( ). To delete a line, click on the icon
  next to it. To delete all lines at once, click on the icon in the table heading and confirm the action in the window that opens.
You can fill in the calculation table in one of the following ways:
- Fill in all fields manually: the value X, the coefficient a, and the displacement b. This method is useful if you know all the required data and want to configure the table on your own.
- Fill in only fields with the value X and the displacement b, and specify zero for the coefficient a. This method is useful if you want to convert an analogue signal to a digital one.
- Fill in only fields with the value X and the coefficient a. In this case, the displacement b is calculated automatically. This method is useful if you want to get a curve when you know only the angles.
- Fill in all fields automatically using the values X and Y. To do this, you should enable and configure the XY pairs.
In the Lower bound and Upper bound fields, you can specify the interval of valid sensor values. All received values which go beyond the specified interval are considered invalid. The specified lower bound is included in the interval of valid values and the upper one is not.
If the Apply after calculation option is enabled, the specified bounds are applied to the processed values Y. If this option is disabled, the bounds are applied to the raw values X.
Working with the chart
To see the calculation result in the chart, click on the icon ![]() above the table.
above the table.
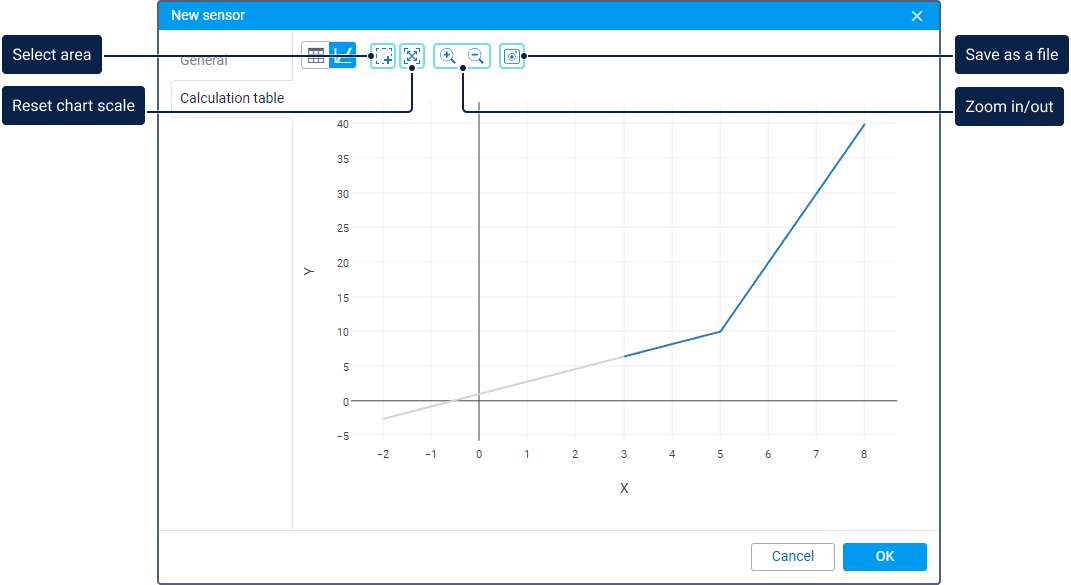
Using the icons above the chart, you can perform the following actions:
| Icon | Action |
|---|---|
| Zoom in to a selected area on the chart. To do this, click on the icon and select the required area while holding the left mouse button. |
| Show the default scale of the chart. Instead of using this icon, you can double-click anywhere inside the chart. |
| Zoom in/Zoom out twice the previous scale. You can also change the scale using the scroll wheel. |
| Save the visible area of the chart to a PNG file. |


If no value limits are specified, the calculation chart extends along the X-axis to the right and left. This is due to the fact that the values in the first interval also influence all values from minus infinity, and the values in the last interval, all values up to plus infinity.
XY pairs
The XY pairs tool is designed to fill in the calculation table automatically. You can use this tool when calibrating sensor values experimentally. For example, you can pour different volumes of fuel into the tank and take the readings of the fuel level sensor corresponding to these volumes. See more information on how to make the calibration of a fuel tank in the guide.
To add the XY pairs and fill in the calculation table automatically, follow the steps below.
- Activate the XY pairs tool.
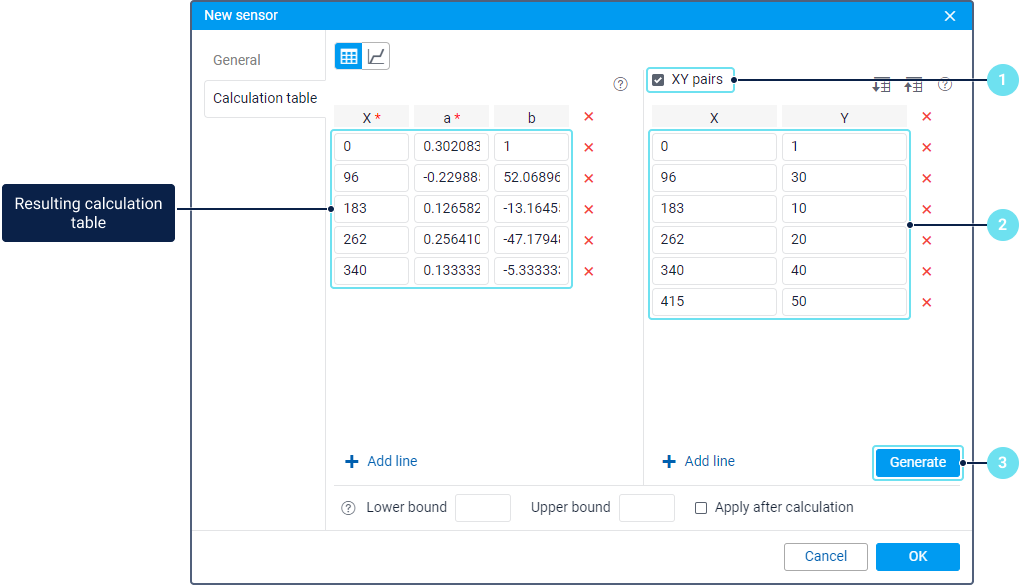
- Specify the input value X (for example, the fuel level sensor value), and the corresponding output value Y (for example, the fuel volume at which this value was received). Add the required number of lines.
You cannot add several lines with the same value X. The values Y can be duplicated.
- Click on the Generate button.
On the left, the calculation table is generated automatically in accordance with the specified values. The table shows one line less than added in the XY pairs. All changes made in the calculation table manually don’t influence the values specified in the XY pairs.
In the calculation table, the value a and the displacement b are calculated by the system in the following way:
- a is calculated by the formula ∆Y / ∆X. The displacement along the X- and Y-axis is calculated separately for each interval, then the displacement along the Y-axis is divided by the displacement along the X-axis.
- b is calculated by the formula b = Y − a × X.
To see the calculation result in the chart, click on the icon ![]() above the table.
above the table.
To the right of the XY pairs tool, the following icons are available:
 . Allows you to export the values of the added XY pairs to a CSV file.
 . Allows you to import values from CSV or TXT files.