Monitoring system metrics with Grafana
Wialon Local exposes internal system metrics in Prometheus format. You can use Prometheus to collect these metrics and Grafana to visualize them using a preconfigured dashboard template. This guide describes how to enable metrics collection, set up Prometheus and Grafana, and import the Wialon Local dashboard template.
Prerequisites
Before you begin, make sure you have:
- A running Wialon Local instance.
- Prometheus installed (or ready to install).
- Grafana installed (or ready to install).
It is recommended to install Prometheus and Grafana on a separate server rather than on the Wialon Local server. Running additional services on the Wialon Local server can affect performance and complicate troubleshooting.
Step 1. Enable metrics collection
To enable the collection of system metrics:
- In the administration system, navigate to System and locate the Settings section.
- Select the Enable metrics service checkbox (the last option in the section).
- Click Save.
- Restart the service when prompted.
After the restart, Wialon Local exposes system metrics in Prometheus format at the following default endpoint:
http://<server-address>/wialon_metrics
where <server-address> is the IP address or domain name of your Wialon Local server.
You can verify that metrics are available by opening this URL in a browser or with curl:
curl http://<server-address>/wialon_metrics
Step 2. Install and configure Prometheus
Install and configure Prometheus on the server you’ve designated for monitoring (a separate server is recommended).
-
In the
prometheus.ymlconfiguration file, add the following scrape job to collect metrics from Wialon Local:scrape_configs: - job_name: "adf" metrics_path: /wialon_metrics static_configs: - targets: ["<wialon-local-address>"]Replace
<wialon-local-address>with the IP address or domain name of your Wialon Local server (for example,192.168.1.100orwialon.yourcompany.com). Since the endpoint is proxied through nginx on the standard HTTP port, you don’t need to specify a port number.See Prometheus documentation for additional information.
-
Start Prometheus with the configuration file:
./prometheus --config.file=prometheus.yml -
Verify that Prometheus is scraping metrics by opening the Prometheus web interface (by default,
http://localhost:9090) and checking Status → Targets. Theadftarget should appear with the UP state.
Step 3. Install Grafana and add the data source
Install Grafana on the same server where Prometheus is running.
- Download and install Grafana.
- Open the Grafana web interface (by default,
http://localhost:3000). - Add Prometheus as a data source:
- Navigate to Connections → Data sources.
- Click Add data source and select Prometheus.
- In the Prometheus server URL field, enter the address of your Prometheus instance (for example,
http://localhost:9090). - Click Save & test to verify the connection.
See Grafana documentation for additional information.
Step 4. Import the dashboard
A preconfigured Grafana dashboard template is available as a JSON file. To import it:
-
Download the dashboard JSON template using this link: local-dashboard-template.json.
-
In Grafana, navigate to Dashboards → New → Import.
-
Click Upload JSON file and select the dashboard template file.
-
Select the Prometheus data source you configured in the previous step.
-
Click Import.
See Grafana documentation for additional information.
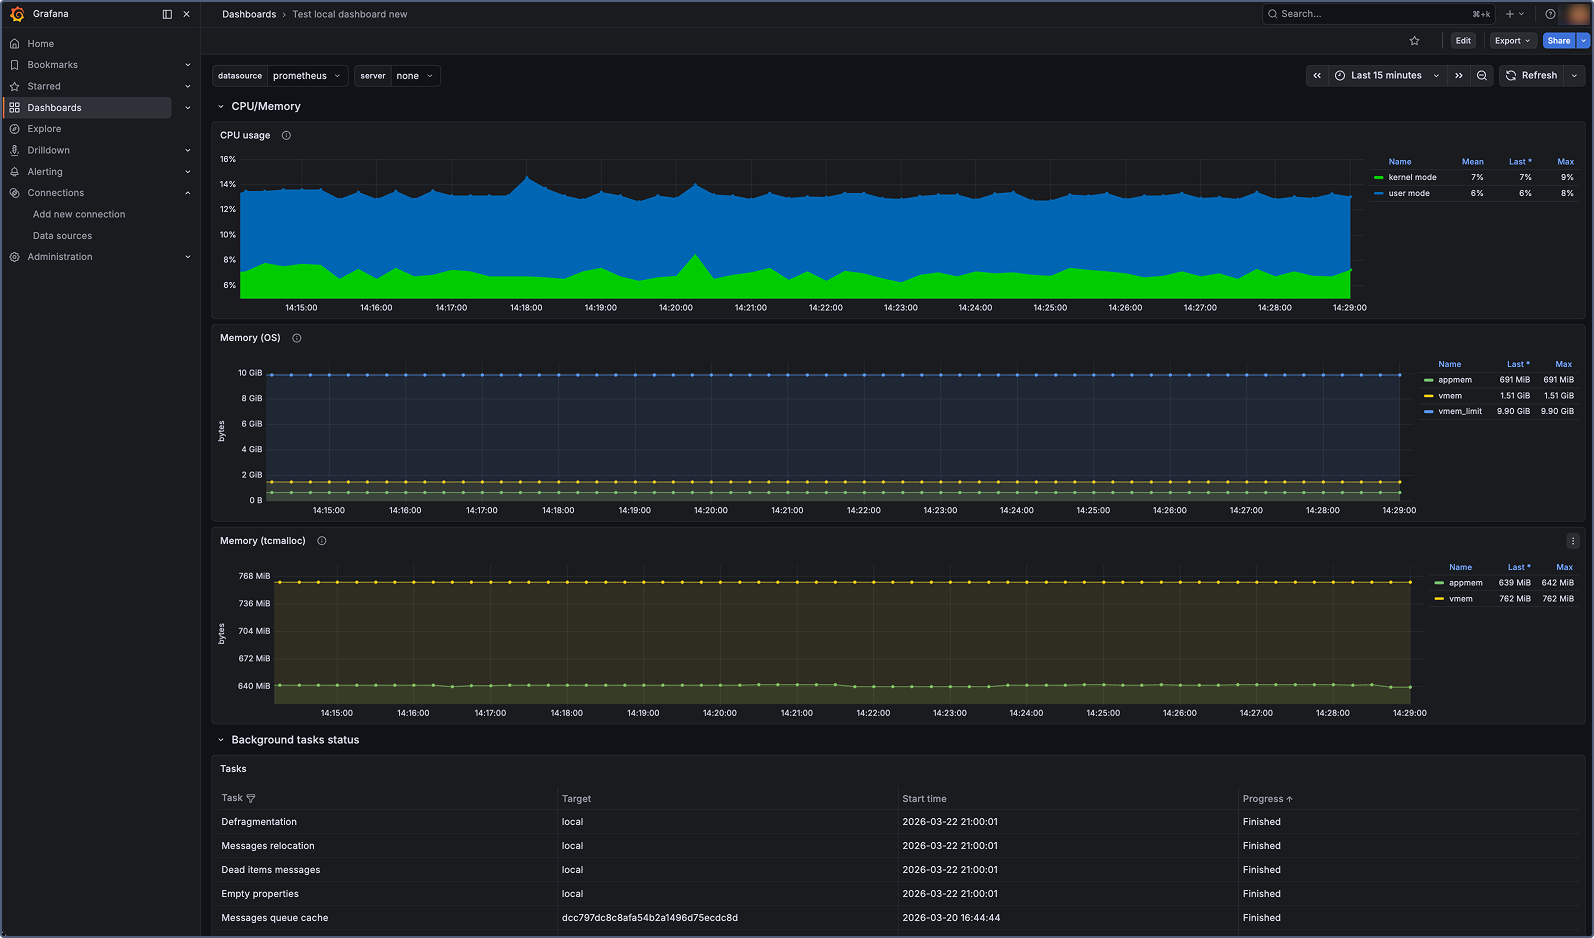
The dashboard displays panels for all key Wialon Local system metrics, including service status, database operations, memory and CPU usage, active sessions, reports, notifications, and more.
Available metrics
The table below lists all system metrics exposed by Wialon Local. For information on metric types, see Metric types.
Service and process metrics
| Metric | Type | Description |
|---|---|---|
adf_process_start_time |
Gauge | Start time of the Wialon Local service (Unix timestamp in seconds). |
adf_process_pid |
Gauge | Process ID (PID) of the running Wialon Local service. |
adf_service_status |
Gauge | Service status: 1 — running, 0 — stopped. |
adf_process_cpu_time_seconds |
Gauge | CPU time spent on process execution (kernel and user mode). |
adf_process_mem_pages_in_mem |
Gauge | Number of process pages in physical memory. |
adf_process_mem_vmem_used |
Gauge | Amount of virtual memory used by the process (in bytes). |
adf_mem_appmem_used |
Gauge | Number of bytes used by application memory. |
adf_mem_vmem_used |
Gauge | Number of bytes used as virtual memory (excluding metadata). |
Database and storage metrics
| Metric | Type | Description |
|---|---|---|
adf_storage_msgs_rw_count |
Counter | Total number of messages written to or read from the database. |
adf_storage_critical_errors |
Counter | Total number of critical errors returned by storage operations. |
adf_sync_server_msgs_flushed_to_fs |
Counter | Number of messages flushed to the file system for a backup server. When the synchronization server is unavailable, messages are temporarily stored on disk and flushed after the server becomes available. |
Thread pool and event queue metrics
| Metric | Type | Description |
|---|---|---|
adf_threads_pool_active |
Gauge | Number of active threads in the global thread pool. |
adf_threads_pool_max |
Gauge | Maximum size of the global thread pool. Configured via the ADF_MAX_THREADS_COUNT environment variable (default: 50). |
adf_events_queue_size |
Gauge | Number of events in the execution queue. Most events in the system (commands, registered messages, and others) pass through this queue. A minimal queue size indicates fast processing. A growing queue indicates degraded performance. |
Script execution metrics
| Metric | Type | Description |
|---|---|---|
adf_script_code_executions |
Counter | Total number of script executions over a 10-minute window. Most external events (for example, API requests) are processed via scripts. This metric can serve as an indicator of system load. |
adf_script_long_exec_number |
Gauge | Number of scripts with execution time exceeding the threshold. The threshold is configured via the ADF_SCRIPT_LONG_EXEC_DETECTION_TIME environment variable (default: 600 seconds). |
Web and session metrics
| Metric | Type | Description |
|---|---|---|
adf_web_ajax_requests_duration_milliseconds |
Counter | Total duration of processed AJAX requests (in milliseconds). |
adf_web_active_sessions |
Gauge | Number of active web sessions. |
Reports and notifications metrics
| Metric | Type | Description |
|---|---|---|
adf_reports_count |
Counter | Total number of processed reports. |
adf_reports_duration_milliseconds |
Counter | Total duration of processed reports (in milliseconds). |
adf_notifications_count |
Counter | Total number of processed notification actions. |
adf_notifications_duration_milliseconds |
Counter | Total duration of processed notification actions (in milliseconds). |
Unit and hardware metrics
| Metric | Type | Description |
|---|---|---|
adf_unit_to_tcp_conn_bindings |
Counter | Total number of unit-to-TCP connection bindings. Units that send data establish connection bindings. |
adf_unit_to_udp_conn_bindings |
Counter | Total number of unit-to-UDP connection bindings. Units that send data establish connection bindings. |
adf_unit_commands_executions |
Counter | Total number of unit command executions. |
adf_retranslator_msgs_sent |
Counter | Total number of messages sent by the retranslator service. |
Jobs metrics
| Metric | Type | Description |
|---|---|---|
adf_jobs_completed |
Counter | Total number of completed jobs. |
Metric types
Wialon Local metrics use two Prometheus metric types:
-
Gauge: Represents a value that can go up or down (for example, the number of active sessions or memory usage). Gauges reflect the current state at a point in time.
-
Counter: Represents a cumulative value that only increases (for example, the total number of processed reports). Counters reset to zero when the service restarts.