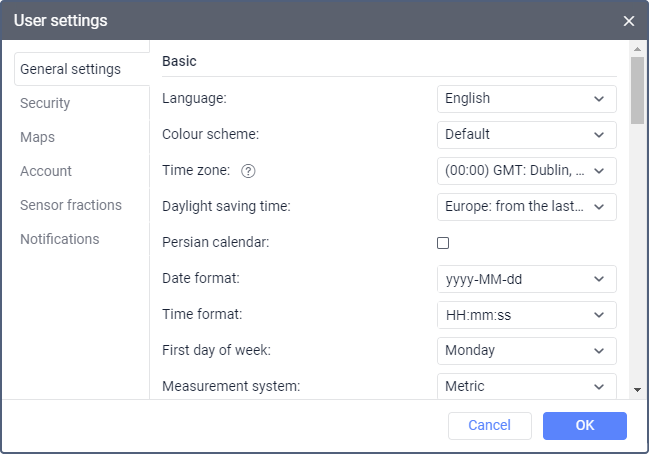
Basic Settings
In this section, you can specify basic interface settings.

Language
Select the interface language. To add a new language to the available ones, contact the service administrator.
Time zone
Select your time zone. It affects the time values in the dialog boxes and bottom bar. To apply the new time zone, reload the page.
Daylight saving time
Select the type of daylight saving time that is used in your region. If you select None, daylight saving time is not applied.
Persian calendar
This option allows you to activate the Persian solar calendar used in countries such as Iran and Afghanistan. If this option is enabled, the Persian calendar replaces the Gregorian calendar in those places where you should specify a time interval (when building tracks, running reports, requesting unit messages, etc.). The change of calendar is applied after you reload the page. Read more about the Persian calendar here.
Date and time format
Specify the date and time formats using the characters provided in the tooltips, or select preset formats from the list of available ones. The elements of the date can be placed in any order.
Below are the format examples:
| Data format | Time format | Example 1 | Example 2 |
|---|---|---|---|
yyyy-MM-dd | HH:mm:ss | 2022-01-25 09:45:33 | 2022-12-02 17:20:00 |
d/MM/yy | HH:mm | 25/01/22 09:45 | 2/12/22 17:20 |
d MMMM yyyy dddd | hh:mm:ss tt | 25 January 2021 Saturday 09:45:33 am | 2 December 2022 Wednesday 05:20:00 pm |
dd MMM yyyy ddd | hh:mm tt | 25 Jan 2021 Sat 09:45 am | 02 Dec 2022 Wed 05:20 pm |
First day of week
Select whether the week should start on Monday or on Sunday. This affects the count of the weeks themselves, the appearance of the calendar, and the display of information when you request messages, reports, and tracks using the Week button.
Measurement system
Select one of the available measurement systems. This setting is taken into account when creating routes, using tools, and calculating distances from units to geofences and cities. When you select a new measurement system, it doesn’t change for the previously created units and resources with their content. For reports, you can select the measurement system in their settings.
This setting also determines what fuel level units are used in the application for Android/iOS.
City
Specify your city. To do this, start typing its name and select the suitable option from the drop-down list.
By default, this field shows the city specified in the same settings of your user’s creator.
This setting is used when using the Nearest units and Address tools. In addition, it determines the position of the map when you log in to the monitoring system. However, if there are units on the map, then upon logging in, the map is scaled so that they are all in view.
Distance from unit to geofence
Activate this option in order for the system to calculate the distance from the unit to a geofence when using the latter as address. In the field to the right, specify the radius within which you want the system to search for geofences near the unit. The maximum allowed value is 100 km or miles, depending on the selected measurement sysrem.
To access this setting, the Geofences service should be enabled in the account properties.
Play sound for events
Enable this option to play a sound when you receive an online notification or message from the driver. Windows users can use QuickTime Alternative as a player. If you are using the Opera browser, then additional configuration may be required so that you are not requested to play or save the file.
Automatically display pop-up events
If this option is enabled, then the received online notifications or messages from the driver are automatically displayed in pop-up windows on the screen. If the option is disabled, then when notifications and messages are received, a numeric indicator is displayed next to the Online notifications and Chat with drivers icons in the bottom panel.
Use keyboard shortcuts
Enable this option to use keyboard shortcuts.
Driver activity by online data
If this option is enabled, then information about the driver’s activity is shown in the driver and unit tooltips, as well as in the extended information about the unit. The data source for this option is selected in the unit properties.
Render charts on server
Activate this option to use static charts in the monitoring system. Activate this option to use static charts in the monitoring system. If the option is enabled, you cannot mark false fillings and drains on charts.
Browser notifications
Online notifications from the monitoring system can be shown in browser push notifications, including when the window is minimised or inactive. To do this, click the Enable button and allow notifications in the pop-up window. After that the button becomes inactive. If notifications for the monitoring site are blocked in the browser settings, you should go to the settings and allow notifications.
To disable browser notifications, go to the browser settings and block notifications for the monitoring site.