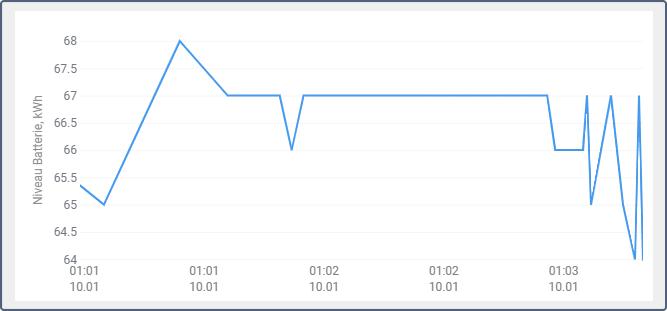
Générer des rapports sur les charges et la consommation de la batterie
Ce guide décrit comment générer des rapports sur les données relatives aux charges et à la consommation des batteries des véhicules électriques.
Dans les rapports, la source de données sur les charges et la consommation des batteries des véhicules électriques est le capteur de niveau de batterie. Les données sur les charges enregistrées manuellement peuvent également être affichées.
Pour visualiser et analyser les données relatives aux charges et à la consommation de la batterie, vous pouvez utiliser les fonctions de rapport suivantes :
- Tableaux de types suivants : Heures moteur, Remplissages et recharges de batterie, Trajets, Zones, Trajets entre les zones, Trajets non terminés, Résumé, Chronologie, Commandes, Affectations. Dans leurs colonnes, vous pouvez afficher les données sur le niveau de batterie, le nombre et le volume des charges, la consommation de la batterie.
Voir Tableaux avec des données sur les charges et la consommation de la batterie, Ajout d’un tableau contenant des données sur la charge de la batterie pour une période spécifiée et Ajout d’un tableau contenant des données sur la consommation de la batterie pour les intervalles de trajets ci-dessous. - Statistiques.
- Graphiques de niveau de batterie et de consommation : réguliers et spéciaux.
- Les périodes de filtrage des autres tableaux (par exemple, les périodes des unités dans une zone, des trajets, etc.) dépendent de la présence ou non de charges. Le filtrage par charges de batterie est disponible pour les tableaux suivants : Compteurs, Capteurs numériques, Heures moteur, Remplissages et recharges de batterie, Zones, Stationnements, Voyages, Arrêts, Trajets entre les zones, Trajets non terminés, Rues visitées.
Tableaux avec des données sur les charges et la consommation de la batterie
Vous trouverez ci-dessous une liste des tableaux de rapport et des colonnes qui y sont disponibles concernant les charges et la consommation de la batterie.
| Tableau | Colonnes |
|---|---|
| Liens | Énergie consommée, Consommation moyenne d'énergie, Niveau de batterie initial, Niveau de batterie final. |
| Chronologie | Toutes les colonnes si le type d'information sur les charges de la batterie est sélectionné. |
| Heures moteur | Énergie consommée, Consommation moyenne d'énergie, Énergie consommée en mouvement, Consommation moyenne d'énergie en mouvement, Énergie consommée au ralenti, Consommation moyenne d'énergie au ralenti, Consommation moyenne d'énergie en trajets, Niveau de batterie initial, Niveau de batterie final, Niveau de batterie maxi, Niveau de batterie mini. |
| Remplissages et recharges de batterie | Niveau de batterie initial, Niveau de batterie final, Chargé, Charge enregistrée, Différence de charge, Nombre de charges |
| Zones | Énergie consommée, Consommation moyenne d'énergie |
| Commandes | Énergie consommée |
| Résumé | Énergie consommée, Consommation moyenne d'énergie, Kilométrage moyen par unité de charge, Niveau de batterie initial, Niveau de batterie final, Total des charges, Chargé |
| Trajets entre les zones | Énergie consommée, Consommation moyenne d'énergie, Niveau de batterie initial, Niveau de batterie final, Niveau de batterie maxi, Niveau de batterie mini |
| Trajets non terminés | Énergie consommée, Consommation moyenne d'énergie, Niveau de batterie initial, Niveau de batterie final, Niveau de batterie maxi, Niveau de batterie mini |
Ajout d’un tableau contenant des données sur la charge de la batterie pour une période spécifiée
Pour ajouter un tableau avec des données sur la charge de la batterie au modèle de rapport, procédez comme suit :
- Dans la section Modèles de rapport de l’onglet Rapports, ouvrez les propriétés du modèle auquel vous souhaitez ajouter le tableau, ou cliquez sur Créer si vous souhaitez créer un nouveau modèle de rapport.
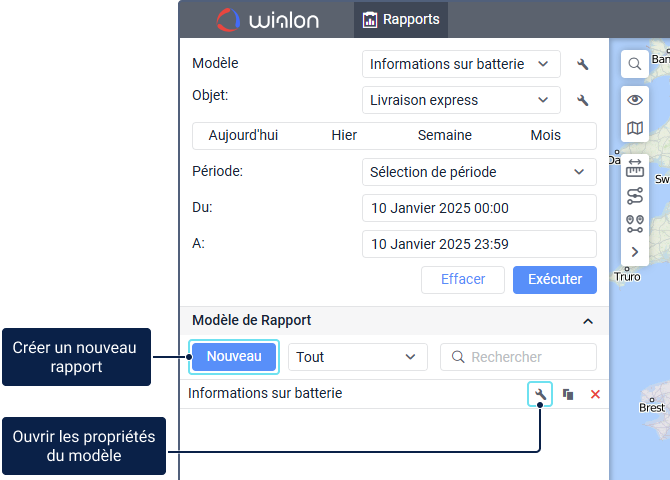
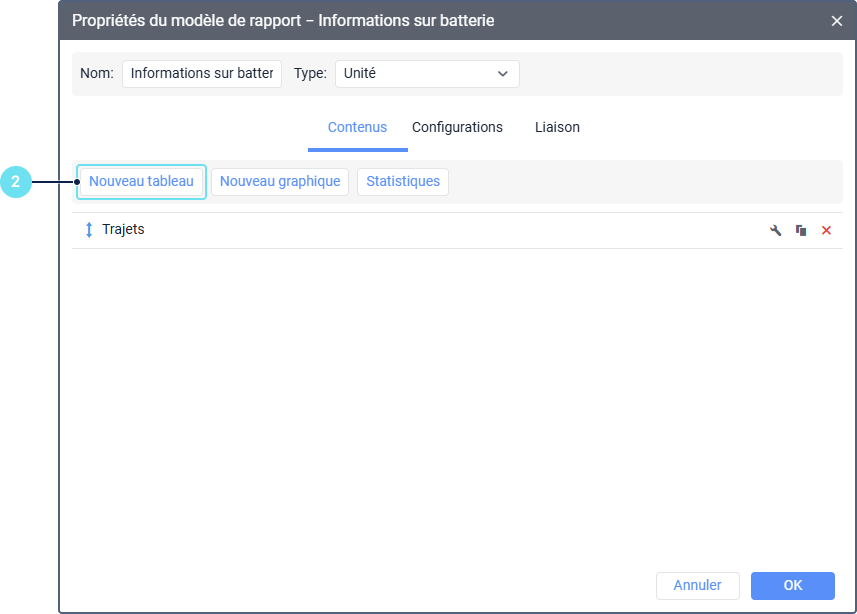
- Cliquez sur le bouton Nouveau tableau.
- Sélectionnez le type de tableau et les colonnes que vous souhaitez voir apparaître dans le rapport. Dans l’exemple ci-dessous, le type de tableau Remplissages et recharges de batterie est sélectionné. Ce tableau affiche à la fois les charges déterminées automatiquement par le système en fonction du capteur de niveau de batterie et les charges enregistrées manuellement par l’utilisateur. Dans l’exemple, les colonnes suivantes sont sélectionnées :
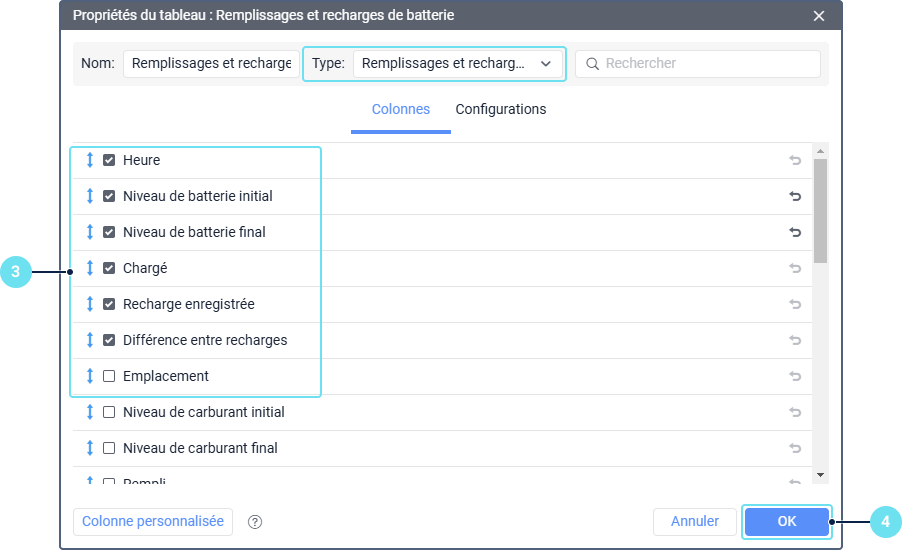
- Heure. Pour les charges trouvées par le système, cette colonne affiche l’heure de la plus grande différence de niveau de charge de la batterie. Pour les charges enregistrées manuellement, elle affiche l’heure spécifiée lors de l’enregistrement.
- Emplacement. Emplacement de l’appareil déterminé par les coordonnées du message reçu pendant la charge de la batterie.
- Niveau de batterie initial. Niveau de la batterie en kWh avant la charge.
- Niveau de batterie final. Niveau de la batterie en kWh après la charge.
- Chargé. La quantité d’énergie par laquelle la batterie a été chargée, en kWh.
- Recharge enregistrée. Volume de charge de la batterie enregistré manuellement, en kWh.
- Différence entre recharges. Différence entre le volume de charge enregistré manuellement et le volume calculé automatiquement à l’aide du capteur de niveau de batterie.
- Cliquez sur OK pour enregistrer le tableau.
- Si nécessaire, vous pouvez ajouter des marqueurs indiquant l’emplacement des charges sur la carte. Pour les charges détectées automatiquement, cochez l’option Positionner les recharges, pour celles enregistrées manuellement (si elles ne correspondent pas à temps aux charges automatiques), cochez l’option Positionner les événements. Les marqueurs de charge sur la carte indiquent les endroits où l’appareil se trouvait pendant la charge. Les marqueurs d’événement indiquent les emplacements spécifiés lors de l’enregistrement de la charge.
- Cliquez sur OK.
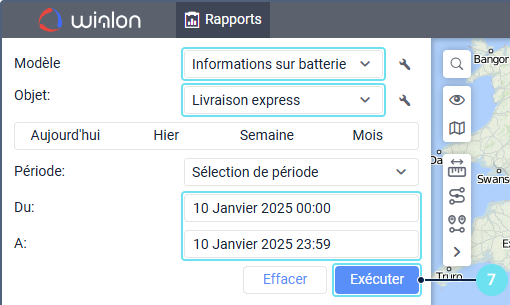
- Dans l’onglet Rapports, sélectionnez le modèle auquel le tableau a été ajouté, l’unité et la période requises, puis cliquez sur Exécuter.
En conséquence, la zone de travail affiche un tableau avec des données sur les charges de la batterie enregistrées manuellement et automatiquement, ainsi qu’une carte avec des marqueurs indiquant les emplacements de charge.
Ajout d’un tableau contenant des données sur la consommation de la batterie pour les intervalles de trajets
Pour ajouter un tableau affichant la consommation de la batterie pendant les trajets, suivez les instructions ci-dessous.
- Suivez les étapes 1 et 2 du guide ci-dessus.
- Sélectionnez le tableau Trajets et choisissez les colonnes que vous souhaitez voir apparaître dans le rapport, y compris Énergie consommée. Dans l’exemple ci-dessous, les colonnes suivantes sont sélectionnées :
- Début. Heure de début du voyage.
- Emplacement initial. Emplacement de l’unité au début du voyage.
- Fin. Heure de fin du voyage.
- Lieu d’arrivée. Emplacement de l’unité à la fin du voyage.
- Énergie consommée. Quantité d’énergie consommée pendant le voyage.
- Consommation moyenne d’énergie. Consommation moyenne de la batterie (en kWh par 100 km ou mi) pendant le voyage.
- Kilométrage moyen par unité de charge. Kilométrage moyen par unité de charge pendant le voyage.
- Niveau de la batterie initial. Niveau de la batterie au début du voyage.
- Niveau de la batterie final. Niveau de la batterie à la fin du voyage.
- Cliquez sur OK pour enregistrer le tableau.
- Dans l’onglet Rapports, sélectionnez le modèle auquel le tableau a été ajouté, puis sélectionnez l’unité et la période requises et cliquez sur Exécuter.
Résultat : La zone de travail affiche alors un tableau dans lequel chaque ligne indique l’intervalle du trajet. Pour chacun d’entre eux, vous pouvez consulter des données sur la consommation d’énergie pendant le trajet, le niveau de la batterie à la fin et au début du trajet, etc.

Statistiques de charge et de consommation de la batterie
Les statistiques sont une partie du rapport qui fournit des données sur l’ensemble de la période sélectionnée pour le rapport. Vous trouverez ci-dessous les sections de statistiques et les lignes disponibles relatives à la charge et à la consommation de la batterie pour le type de rapport Unité.
| Section | Lignes |
|---|---|
| Statistiques | Énergie consommée, Consommation moyenne d'énergie, Niveau de batterie initial, Niveau de batterie final, Niveau de batterie maxi, Niveau de batterie mini |
| Heures moteur | Énergie consommée en h/m, Consommation moyenne d'énergie en h/m, Énergie consommée en h/m en mouvement, Consommation moyenne d'énergie en h/m en mouvement, Énergie consommée en h/m au ralenti, Consommation moyenne d'énergie en h/m au ralenti |
| Remplissage de carburant et charge de la batterie | Total chargé, Total chargé enregistré manuellement, Différence de charge, Total des charges |
| Trajets | Énergie consommée en trajets, Consommation moyenne d'énergie en trajets, Kilométrage moyen par unité de charge en trajets |
| Commandes | Consommation moyenne d'énergie pour une commande, Énergie consommé pour les commandes |
Ajout de statistiques sur la charge et la consommation de la batterie
Pour ajouter des statistiques sur la charge et la consommation de la batterie au modèle de rapport, procédez comme suit :
- Dans la section Modèles de rapport de l’onglet Rapports, ouvrez les propriétés du modèle auquel vous souhaitez ajouter le tableau, ou cliquez sur Nouveau si vous souhaitez créer un nouveau modèle de rapport.

- Cliquez sur le bouton Statistiques.
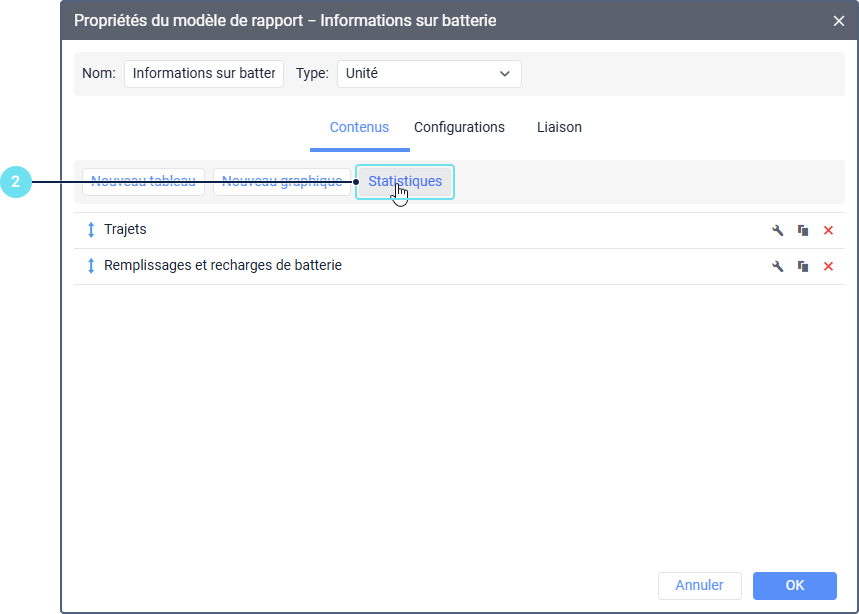
- Sélectionnez les lignes nécessaires relatives aux charges et à la consommation de la batterie. Dans l’exemple ci-dessous, les lignes suivantes sont sélectionnées :
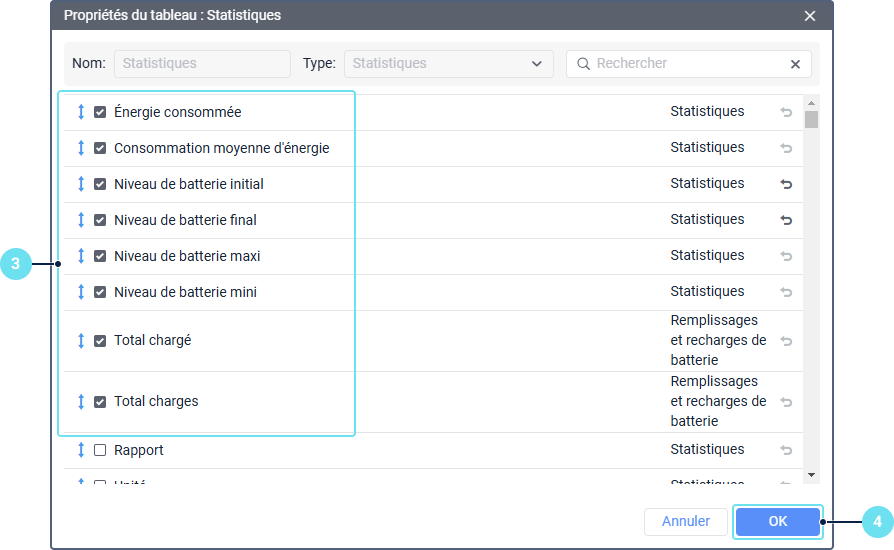
- Energie consommée. Charge de batterie consommée en kWh pour la période du rapport, calculée sur la base des relevés du capteur de niveau de batterie.
- Consommation moyenne d’énergie. Consommation moyenne de batterie en kWh pour la période du rapport, calculée sur la base des relevés du capteur de niveau de batterie.
- Niveau de la batterie initial. Niveau de la batterie en kWh au début de l’intervalle pour lequel le rapport est généré.
- Niveau de la batterie final. Niveau de la batterie en kWh à la fin de l’intervalle pour lequel le rapport est généré.
- Niveau de batterie maxi. Niveau de batterie maximum en kWh dans l’intervalle pour lequel le rapport est généré.
- Niveau de batterie mini. Niveau de batterie minimum en kWh dans l’intervalle pour lequel le rapport est généré.
- Total charges. Le nombre de charges de batterie dans l’intervalle pour lequel le rapport est généré.
- Total chargé. La quantité totale d’énergie en kWh par laquelle la batterie a été chargée dans l’intervalle pour lequel le rapport est généré.
- Cliquez sur OK.
- Dans l’onglet Rapports, sélectionnez le modèle auquel le tableau a été ajouté, puis sélectionnez l’unité et la période requises, et cliquez sur Exécuter.
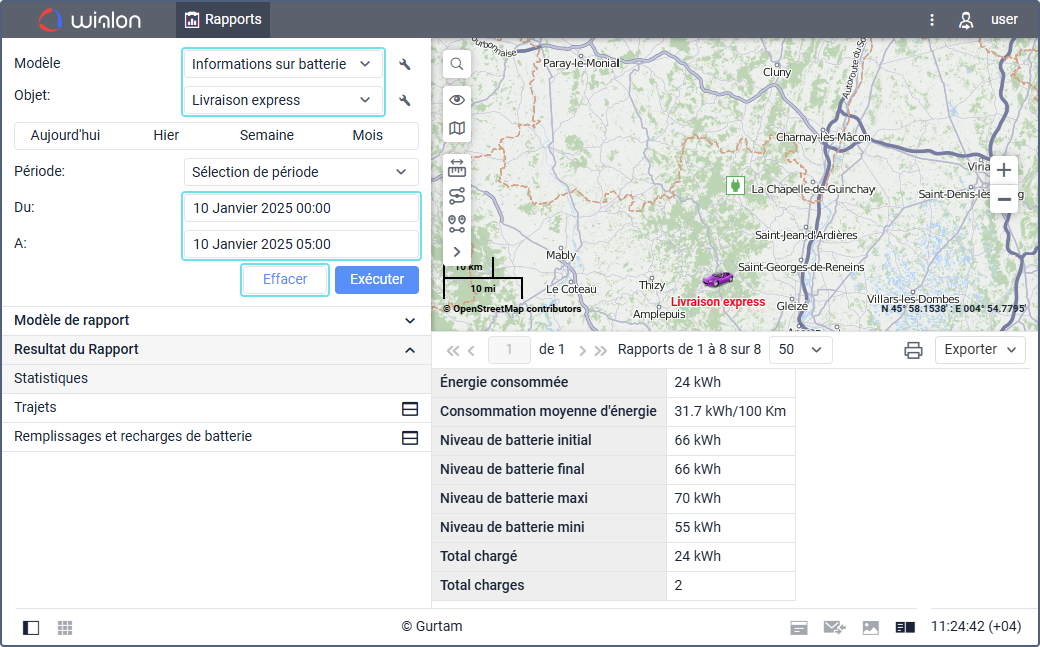
Résultat : Un tableau contenant les lignes de Statistiques s’affiche alors dans la zone de travail.
Graphiques de niveau de batterie et de consommation
Des informations sur la charge et la consommation de la batterie sont disponibles dans les tableaux suivants :
- Régulier
- Niveau de batterie traité (charges, consommation)
- Vitesse/consommation de batterie
Le grahique Régulier contient les courbes Niveau de batterie, Niveau de batterie traité et Consommation de la batterie.
Ajout d’un graphique avec des données sur la charge de la batterie et la consommation
Pour ajouter au modèle de rapport un graphique contenant des données sur la charge de la batterie et la consommation, procédez comme suit :
- Dans la section Modèles de rapport de l’onglet Rapports, ouvrez les propriétés du modèle auquel vous souhaitez ajouter le graphique, ou cliquez sur Nouveau si vous souhaitez créer un nouveau modèle de rapport.

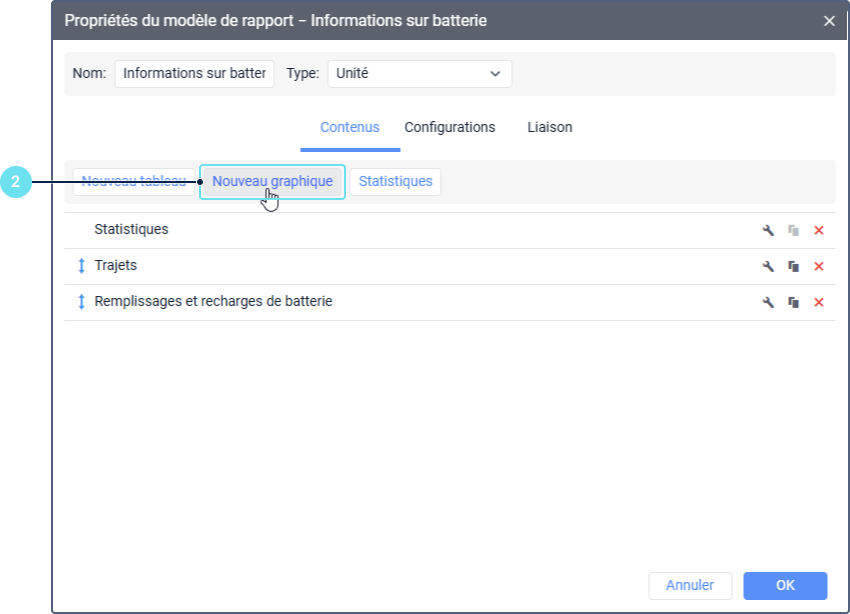
- Cliquez sur le bouton Nouveau graphique.
- Sélectionnez le type de graphique : Régulier, Niveau de batterie traité ou Vitesse/Consommation de la batterie. Pour les deux derniers, la sélection des colonnes n’est pas nécessaire. Dans l’exemple ci-dessous, le type de Niveau de batterie traité est sélectionné.
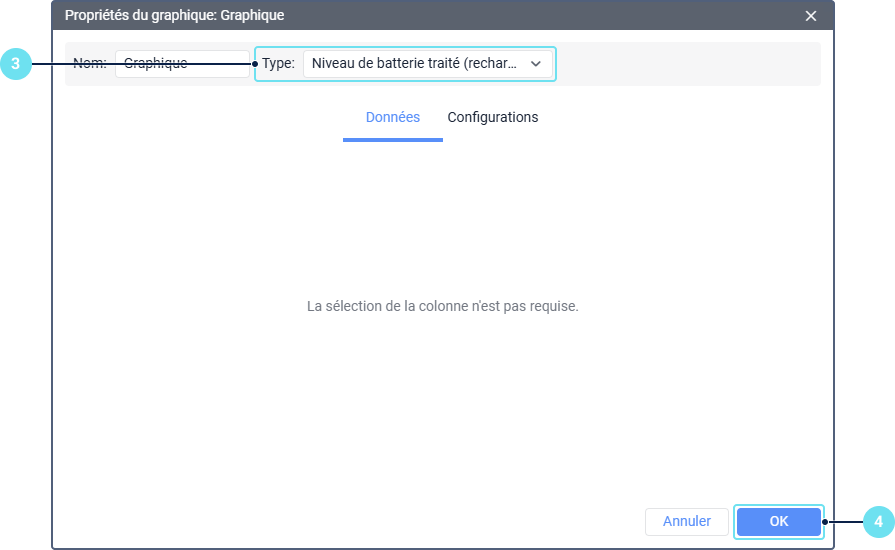
- Cliquez sur OK.
- Dans l’onglet Rapports, sélectionnez le modèle auquel le graphique a été ajouté, puis sélectionnez l’unité et la période requises, et cliquez sur Exécuter.
Résultat : Le graphique affiche la dépendance du niveau de charge de la batterie par rapport au temps (kWh/temps). La ligne du graphique est lissée en tenant compte du type de filtrage sélectionné dans les paramètres du capteur.
