Charts
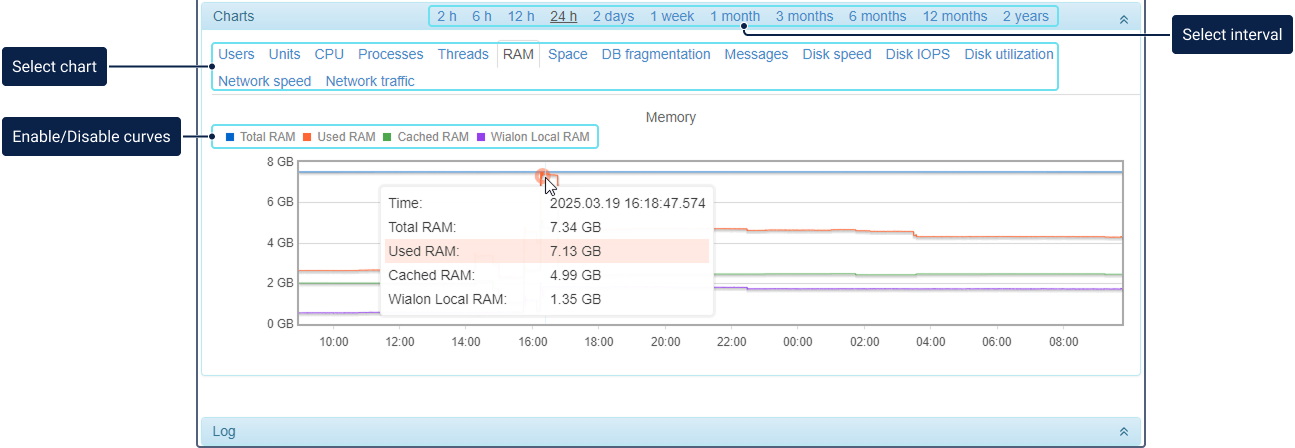
The Charts section displays visual information on various characteristics. The time interval is selected in the upper right part of the section.
The table below lists all the charts and the curves available for them.
| Chart | Curves |
|---|---|
| Users | Users, Sessions |
| Units | Units, Units online |
| CPU | CPU, Load average |
| Processes | Processes |
| Threads | Threads (the total number of all threads in the system), Wialon threads (threads occupied by Wialon), Local threads (threads occupied by the wlocal service), Wialon active threads |
| RAM | Total RAM, Used RAM, Cached RAM, RAM Wialon Local |
| Space | Total space, Used space, DB, Messages, Properties, Files, Messages cache, Logs directory, Tmp directory, Synchronization cache, Transaction cash, Compressed messages (the latter is available if the Database compression option is enabled) |
| DB fragmentation | DB Fragmentation |
| Message intensity (Message tab) | Read messages, Written messages, Messages requests |
| Total number of messages (Message tab) | Total number of messages |
| Disk speed | A curve for each disk where the DB is located |
| Disk IOPS | A curve for each disk where the DB is located |
| Disk utilization | A curve for each disk where the DB is located |
| Network speed | Download speed, Upload speed |
| Network traffic | Downloaded data, Uploaded data |
To enable or disable the display of any curve, click on its name above the chart.
The gaps in some sections of the curves indicate that the wlocal service was stopped at the time intervals to which the curves correspond (for the Users/Units charts, it signals that Wialon was stopped).
When you hover the mouse cursor over the point of the chart, tooltips appear.