Statistics
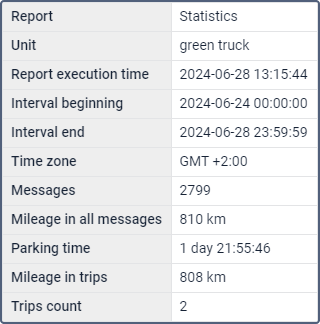
Statistics is a special table that includes summary data for the selected report period. It provides information about the report as a whole, such as the start and end of the report interval, number of messages, unit name, time zone, report execution time, and other data that depends on the report template type.
If the report is executed for a unit, then statistics can include data from other tables, such as Engine hours, Trips, Eco driving, and others. See the complete list of statistics rows for different report types in the sections Rows in the “Statistics” table for report on units and Rows in the “Statistics” table for other report types.
Statistics consists of the selected rows and their values.
Adding statistics
To add statistics to a report template, follow the steps below:
-
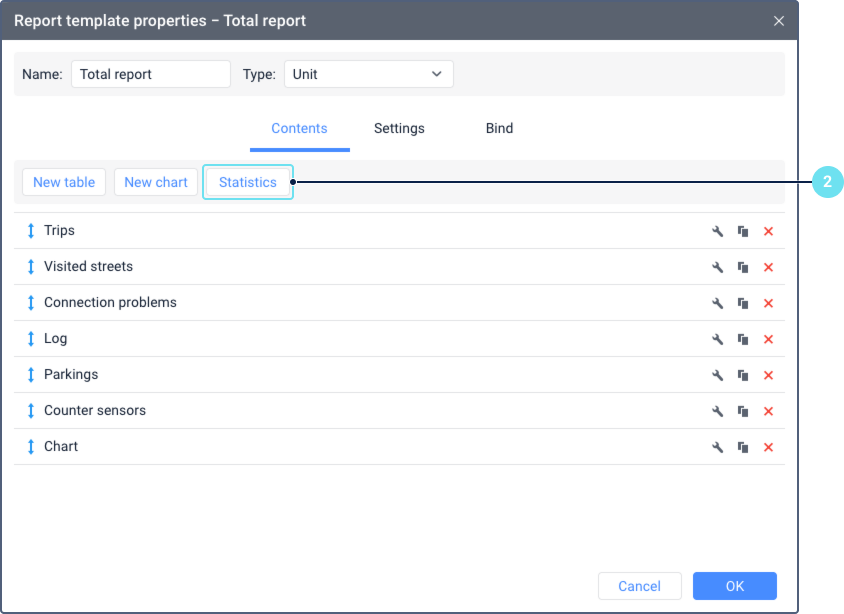
Open the properties of the report template to which you want to add statistics.
-
On the Contents tab, click on the Statistics button.
-
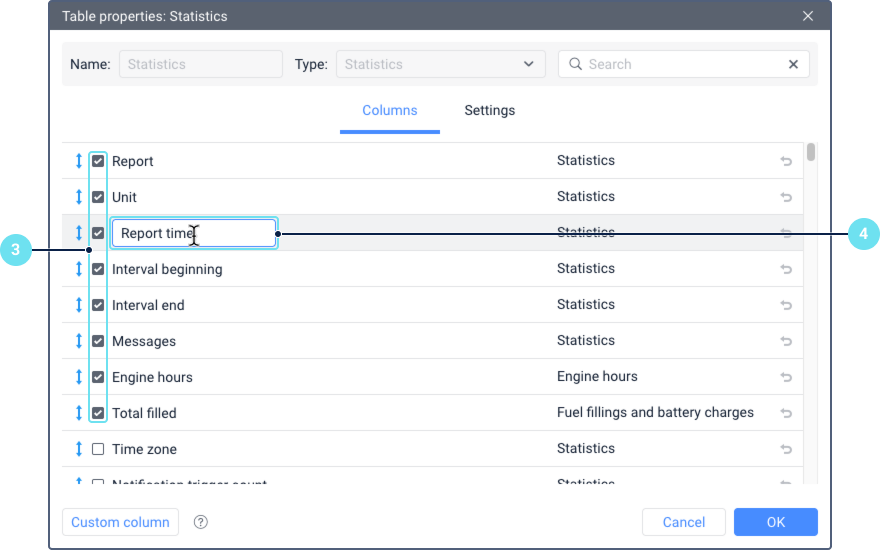
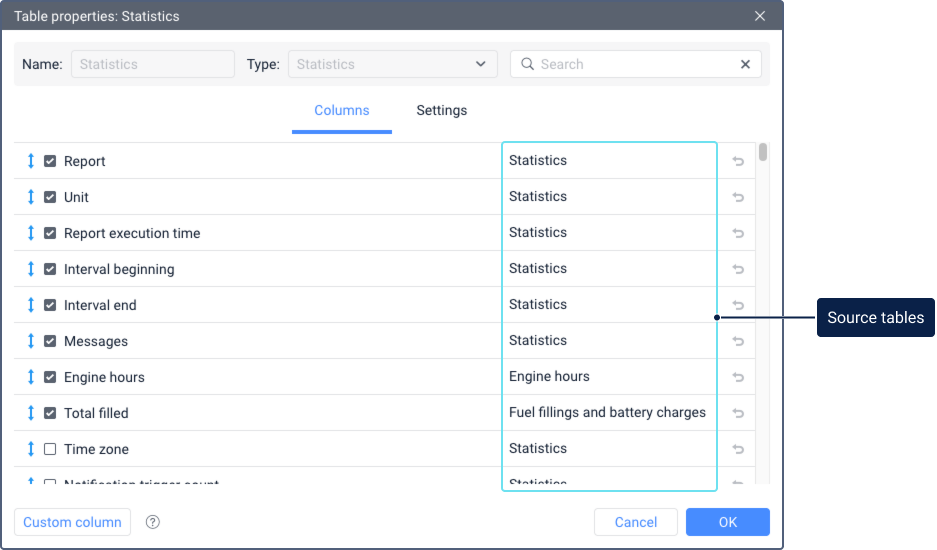
On the Columns tab, select the necessary rows, that is, the data you want to see in the table. Next to the row name, the table that serves as the data source for this row is displayed. See the description of all rows in the sections Rows in the “Statistics” table for reports on units and Rows in the “Statistics” table for other report types.
For a quick search, use the dynamic search, which works by row name and source table.If the table doesn’t have the row you need, you can create your own based on existing columns or other data using the Custom column button. See the Tables page for detailed information.
-
If necessary, edit the row names:
-
To rename the row, click on the row and make changes.
-
To return to the original name, click on the icon
 .
.
-
-
If necessary, configure the order of rows. To do this, drag them using the icon
 next to their names.
 -
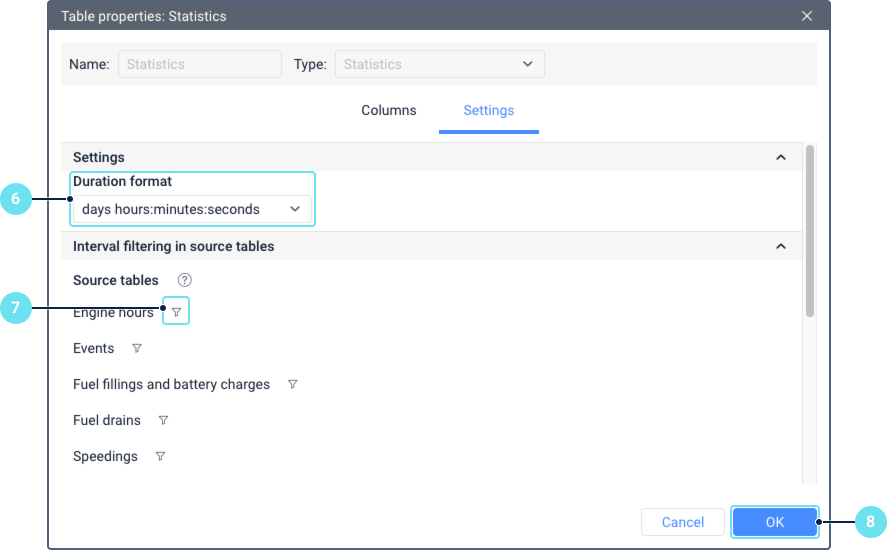
On the Settings tab, select the format in which time intervals should be displayed. See the description of the Duration format option on the Settings page.
-
If necessary, configure interval filtering in the table that serves as the data source for the selected rows. This may be necessary if you don’t want to include certain table intervals in the final calculation. See more details in the section Filtering intervals in source tables.
-
Click OK to save the changes.
As a result, the statistics table is added to the content list of the report template.
The Statistics table is always first in the list in the report template and can’t be moved.
Filtering intervals in source tables
Source tables are the tables that provide data for calculating the value of a statistics row. The name of the source table is shown next to the row name on the Columns tab.
Filtering allows you to select specific table intervals that should be considered for calculating the final value in the statistics row. Intervals depend on the table type. In the Engine hours table, intervals are engine operation periods based on the engine hours sensor, in the Eco driving table — violations, and so on. For example, you can configure the table to show only those engine operation periods during which the vehicle was parked or only those violations that lasted longer than 1 minute.
In statistics, interval filtering is available only for reports of the Unit type.
To configure interval filtering in statistics, follow the steps below:
-
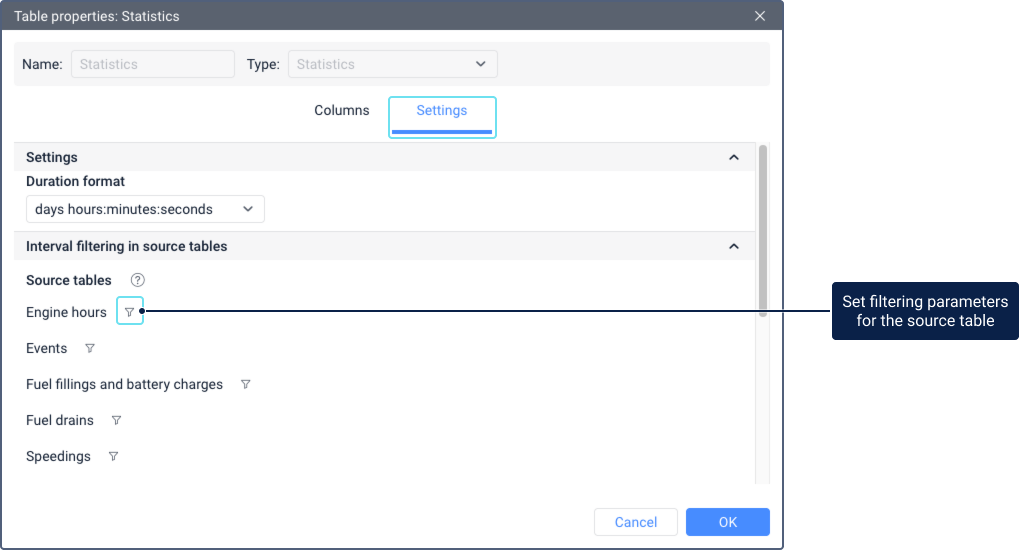
Go to the Settings tab in the properties of the Statistics table.
-
Click on the icon
 next to the name of the source table.
-
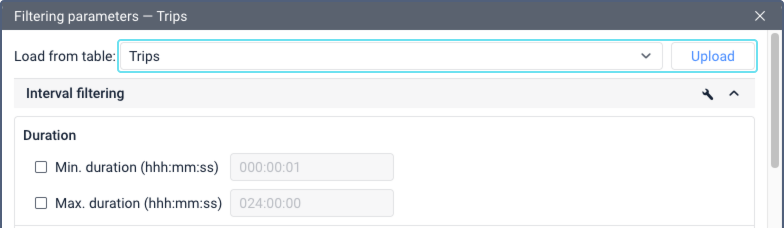
In the Filtering parameters window, configure the conditions for including intervals in the table. See the description of all filters on the Interval filtering page.
If the report template already has a table with filtering configured, you can apply it to the Statistics table. To do this, select this table at the top of the window and click Load.
-
If necessary, configure the order in which filters should be applied. To do this, click on the icon
 in the Interval filtering row and drag the filters in the list using the icon .
As a result, the values of statistics rows associated with this table are recalculated according to the configured filtering.
If you have configured filtering for a table, but rows from it are not selected on the Columns tab, then these settings are not applied and are not saved.
Tables for which interval filtering can be configured in statistics:
- Counter sensors
- Eco driving
- Engine hours
- Events
- Fuel drains
- Fuel fillings and battery charges
- Images
- Maintenance
- Orders
- Parkings
- Speedings
- Stops
- Trips
- Unit latest data
- Violations
- Visited streets
Rows in the “Statistics” table for report on units
Below are the rows available for adding to statistics for reports of the Unit type. They are grouped by source table type.
Statistics
| Row | Description |
|---|---|
| Report | The name of the report template. |
| Unit | The name of the unit. |
| Report execution time | The time of report generation when a user executed the report online or it was generated automatically as a job or notification. |
| Interval beginning | The beginning of the reporting interval. |
| Interval end | The end of the reporting interval. |
| Time zone | The time zone set in the user settings. |
| Messages | The messages analyzed within the reporting period. |
| Mileage in all messages | The mileage in all messages according to the selected mileage counter (without filtering by the trip detector). |
| Fuel consumed | The amount of consumed fuel detected by any sort of fuel sensor. If several such sensors are available, their values sum up. |
| Consumed by ImpFCS/AbsFCS/InsFCS/FLS/math/rates | The amount of consumed fuel detected by a fuel sensor (such as impulse/absolute/instant fuel consumption sensor, fuel level sensor) or calculated by math or rates. |
| Consumed by ImpFCS/AbsFCS/InsFCS/FLS/math/rates in motion | The amount of fuel consumed during the movement of the unit calculated by the methods described above.
|
| Consumed by ImpFCS/AbsFCS/InsFCS/FLS/math/rates without motion | The amount of fuel consumed during the time when the unit was without movement calculated by the methods described above. |
| Avg. fuel consumption | The average fuel consumption by any sort of fuel sensor. If several such sensors are available, their values sum up. |
| Avg. consumption by ImpFCS/AbsFCS/InsFCS/FLS/math/rates | The average fuel consumption in trips detected by one of the methods mentioned above. It can be presented either as liters per 100 kilometers or miles per one gallon. The whole mileage of the reported interval is normally taken for these calculations. However, average consumption by FLS can take either all mileage or mileage by the trip detector. |
| Initial fuel level | The fuel level at the beginning of the interval. |
| Final fuel level | The fuel level at the end of the interval. |
| Max. fuel level | The maximum fuel level. |
| Min. fuel level | The minimum fuel level. More information about the fuel in reports can be found here. |
| Energy consumed | The amount of consumed battery energy in kWh calculated using the readings of the battery level sensor. |
| Avg. energy consumption | The average battery consumption in kWh calculated using the readings of the battery level sensor. |
| Initial battery level | The battery level in kWh at the beginning of the report interval. |
| Final battery level | The battery level in kWh at the end of the report interval. |
| Max. battery level | The maximum battery level in kWh within the report interval. |
| Min. battery level | The minimum battery level in kWh within the report interval. |
Engine hours
| Row | Description |
|---|---|
| Engine hours | The duration of the engine hours. It can be calculated by the engine hours sensor or by the ignition sensor depending on the unit properties. |
| Initial engine hours | The Absolute engine hours sensor value at the start of the engine hours interval. Calculated in the same way as in the Engine hours table. |
| Final engine hours | The value of engine hours at the end of the interval. The value is calculated based on the initial engine hours. |
| Engine hours in motion | The time interval during which the unit was in motion. |
| Engine hours while idling | The total time interval during which the unit did not move with the engine running (idling). |
| Mileage in engine hours | The distance travelled during the engine hours operation. |
| Initial mileage in engine hours | The value of the mileage sensor at the moment of the beginning of the reporting period. |
| Final mileage in engine hours | The value of the mileage sensor at the end of the reporting period. |
| Avg. engine revs | The average rate of engine revolutions. |
| Max. engine revs | The maximum rate of engine revolutions. |
| Avg. temperature in e/h | The average temperature during the engine hours. |
| Engine efficiency duration | The duration of the attached implements operation (if there is an engine efficiency sensor). |
| Engine efficiency idling | The engine hours minus the engine efficiency time. |
| Utilization | The duration of the engine hours work divided by the engine hours rate, indicated on the Advanced tab of the device properties. |
| Useful utilization | The duration of the engine efficiency divided by the engine hours rate. |
| Productivity | The duration of the engine efficiency divided by the engine hours duration. |
| Fuel consumed in e/h | The volume of the consumed fuel detected by any sort of fuel sensor. If several such sensors are available, their values sum up. |
| Consumed by ImpFCS/AbsFCS/InsFCS/FLS/math/rates in e/h | The fuel volume used during the interval of engine hours. It can be detected by a fuel sensor (such as impulse/absolute/instant fuel consumption sensor, fuel level sensor) or calculated by math or rates. More information about the fuel in reports can be found here. |
| Energy consumed in e/h | The amount of consumed battery energy in kWh during engine operation. |
| Avg. fuel consumption in e/h | The average fuel consumption by any sort of fuel sensor. If several such sensors are available, their values sum up. |
| Avg. consumption by ImpFCS/AbsFCS/InsFCS/FLS/math/rates in e/h | The average fuel consumption in the engine hours determined in accordance with a fuel sensor readings or calculated by math or rates. |
| Avg. energy consumption in e/h | The average battery consumption in kWh during engine operation. |
| Consumed by ImpFCS/AbsFCS/InsFCS/FLS/math/rates in e/h in motion | The amount of fuel consumed during the interval of engine hours while the unit was moving. It can be detected by a fuel sensor (such as impulse/absolute/instant fuel consumption sensor, fuel level sensor) or calculated by math or rates. |
| Energy consumed in e/h in motion | The amount of consumed battery energy in kWh during engine operation while the unit was moving. |
| Avg. consumption by ImpFCS/AbsFCS/InsFCS/FLS/math/rates in e/h in motion | The average fuel consumption while the unit was moving. It can be detected by a fuel sensor (such as impulse/absolute/instant fuel consumption sensor, fuel level sensor) or calculated by math or rates. |
| Avg. energy consumption in e/h in motion | The average battery consumption in kWh during engine operation while the unit was moving. |
| Consumed by ImpFCS/AbsFCS/InsFCS/FLS/math/rates in idle run | The fuel volume used during engine operation while the unit was parked with the ignition on. It can be determined in accordance with a fuel sensor readings or calculated by math or rates. |
| Energy consumed in idle run | The amount of consumed battery energy in kWh during engine operation while the unit was parked with the ignition on. |
| Avg. consumption by ImpFCS/AbsFCS/InsFCS/FLS/math/rates in idle run | The average fuel consumption during engine operation while the unit was parked with the ignition on. It can be detected by a fuel sensor (such as impulse/absolute/instant fuel consumption sensor, fuel level sensor) or calculated by math or rates. |
| Avg. energy consumption in idle run | The average battery consumption in kWh during engine operation while the unit was parked with the ignition on. |
| Avg. consumption by ImpFCS/AbsFCS/InsFCS/FLS/math/rates in e/h in trips | The average fuel consumption during the work of engine hours in trips determined in accordance with a fuel sensor readings or calculated by math or rates. |
Events
| Row | Description |
|---|---|
| Events count | The number of registered events. |
Fuel fillings and battery charges
| Row | Description |
|---|---|
| Total filled | The volume of fuel filled within the report interval. |
| Total filled as registered manually | The total volume of the fuel fillings registered manually. |
| Filling difference | The difference between the filling volume determined by the sensors and the filling volume registered manually. |
| Total charged | The total amount of energy in kWh by which the battery was charged during the report interval. |
| Total charged as registered manually | The total amount of energy in kWh by which the battery was charged, as indicated during manual charge registration. |
| Charge difference | The difference between the amount of charges determined by the sensor and the amount of charges registered manually. Measured in kWh. |
| Total fillings | The number of fuel fillings detected within the report period. |
| Total charges | The number of battery charges detected within the report interval. |
Fuel drains
| Row | Description |
|---|---|
| Total drained | The total volume of potentially drained fuel. |
| Total drains | The number of potential fuel drains detected within the reporting period. |
Health check incidents
| Row | Description |
|---|---|
| Incident count | The number of device incidents registered within the report interval. See the Health check page for information on how to configure incident registration. |
Tasks
| Row | Description |
|---|---|
| Task count | The number of tasks created for the unit within the report interval. For information about task creation, see Creating tasks. |
SMS messages
| Row | Description |
|---|---|
| SMS messages | The number of SMS messages received from a unit. |
Speedings
| Row | Description |
|---|---|
| Initial mileage | The mileage sensor reading at the time of the start of the first speeding at the reporting interval. If there is no mileage sensor, the mileage is counted from 0. |
| Final mileage | The mileage sensor reading at the end of the speeding interval. |
Parkings
| Row | Description |
|---|---|
| Parking time | The total duration of parkings for the reporting period. Parking is determined by the trip detector. If it is disabled, the number of parkings is counted as zero. |
| Parkings count | The number of parkings for the reporting period. |
Stops
| Row | Description |
|---|---|
| Stops count | The number of stops for the reporting period. |
Trips
| Row | Description |
|---|---|
| Time in trips | The total duration of all trips. |
| Engine hours | The engine hours value. |
| Mileage in trips | The total distance travelled in all trips. |
| Mileage (adjusted) | The total mileage of the movement intervals determined by the trip detector, multiplied by mileage coefficient (the setting in the additional properties of the unit). |
| Urban mileage in trips | The distance travelled at a speed that is defined as the speed in the city. |
| Suburban mileage in trips | The distance travelled at a speed that is defined as the speed outside the city. The speed limit is configured in the additional settings of the unit. |
| Initial mileage in trips | The mileage sensor value at the beginning of the report interval. Calculated in the same way as the value in the Initial mileage column in the Trips table. |
| Final mileage in trips | The mileage sensor value at the end of the report interval. The value is calculated based on the initial mileage. |
| Toll roads mileage | The distance that a unit travelled during the trip on the roads on which the Platon system is used. |
| Toll roads cost | The sum of money (in RUB) for the toll roads mileage calculated on the basis of the covered distance and the Platon tariff. |
| Average speed in trips | The average speed in trips (total mileage divided by the time of travel). |
| Max. speed in trips | The maximum speed registered during the trips. |
| CO2 emissions | The amount of CO2 emissions during the trips. It is calculated by multiplying the value in the Mileage in trips row by the value specified on the Profile tab in the unit properties. |
| Trips count | The number of trips. |
| Fuel consumed in trips | The volume of consumed fuel detected by any sort of fuel sensor. If several sensors are available, their values sum up. |
| Consumed by ImpFCS/AbsFCS/InsFCS/FLS/math/rates in trips | The fuel consumed in trips. It can be detected by a fuel sensor (such as impulse/absolute/instant fuel consumption sensor, fuel level sensor) or calculated by math or rates. More information about fuel in reports can be found here. |
| Energy consumed in trips | The amount of consumed battery energy in kWh calculated using the readings of the battery level sensor during trips. |
| Rates deviation by ImpFCS/AbsFCS/InsFCS/FLS in trips | The difference between the fuel consumption detected by a sensor and the fuel consumption rates. |
| Avg. consumption in trips | The average fuel consumption by any sort of fuel sensor. If several such sensors are available, their values sum up. |
| Avg. consumption by ImpFCS/AbsFCS/InsFCS/FLS/math/rates in trips | The average fuel consumption in trips determined in accordance with a fuel sensor readings or calculated by math or rates. |
| Avg. energy consumption in trips | The average consumption of battery energy in kWh calculated using the readings of the battery level sensor during trips. |
| Avg. mileage per unit of fuel by ImpFCS/AbsFCS/InsFCS/FLS/math/rates in trips | The average fuel consumption presented as kilometers per liter or as miles per gallon. |
| Avg. mileage per unit of charge | The average mileage per unit of charge calculated using the readings of the battery level sensor during trips. |
Violations
| Row | Description |
|---|---|
| Violations count | The number of violations registered within the reporting period. |
Sent commands
| Row | Description |
|---|---|
| Sent commands | The number of commands sent to a unit. |
Unit latest data
All the rows in this section do not depend on the reporting interval. The latest information is taken at the moment of the report execution.
| Row | Description |
|---|---|
| Mileage counter | The mileage counter value. |
| Engine hours counter | The engine hours counter value. |
| GPRS traffic counter | The consumed traffic. |
| Unit last location | The latest unit location detected (address or coordinates). |
| Last message time | The time when the latest message from the unit was received. |
Visited streets
| Row | Description |
|---|---|
| Streets count | The number of visits of streets. |
Maintenance
| Row | Description |
|---|---|
| Total maintenance duration | The duration of all registered services. |
| Total maintenance cost | The total cost of all maintenance works. |
| Services count | The number of services performed. |
Utilization cost
| Row | Description |
|---|---|
| Total utilization cost | The total cost of all registered service works and fuel fillings. |
| Services and fillings count | The total number of all registered service works and fuel fillings. |
Counter sensors
| Row | Description |
|---|---|
| Total counter | The sum of values of all sensors of the counter type. |
Images
| Row | Description |
|---|---|
| Images count | The number of images received from the unit. And if there are any, the resulting report contains a section with all the received images for the reporting period. The supported format is JPEG. |
Eco driving
| Row | Description |
|---|---|
| Penalties | The overall penalty for various Eco driving criteria for the reporting period. Penalty averaging can be adjusted in report settings. |
| Rank | The received penalty points converted into a grade using a 10-point scoring system. |
Video
| Row | Description |
|---|---|
| Videos count | The number of video files received from a unit. |
Orders
| Row | Description |
|---|---|
| Total orders | The total amount of orders within the indicated time period. |
| Orders visited | The orders in which the arrival of a courier to an address is detected or any status is set. |
| Orders visited in time | The orders in which the arrival of a courier to an address is detected on time (in advance) or any status is set. |
| Orders visited late | The orders in which the arrival of a courier to an address is detected late or any status is set late. |
| Non-visited orders | The orders in which the arrival of a courier to an address is not detected. |
| Confirmed orders | The orders in which the arrival of a courier to an address is registered, the Confirm status is set. |
| Visited, not confirmed | The orders that have been visited but have not been confirmed (including rejected orders). |
| Not visited, not confirmed | The orders that have been neither visited nor confirmed. |
| Not visited, confirmed | The orders that have not been visited but have been confirmed. |
| Visited, confirmed | The orders that have been visited and confirmed. |
| Orders rejected | The orders for which the Reject status is set. |
| Order’s avg. time (estimated) | The ratio of the time calculated by the system for the delivery of all orders to the total number of orders. |
| Order’s avg. time (actual) | The ratio of time spent delivering orders to a total amount of orders. |
| Avg. time deviation in orders | The difference between the actual and estimated average time for delivery of an order. |
| Order’s avg. mileage (actual) | The ratio of a distance covered by a courier to a total amount of orders. |
| Order’s avg. weight | The ratio of the total weight of orders to their total number. |
| Order’s avg. volume | The ratio of the total volume of orders to a total amount of orders. |
| Order’s avg. cost | The ratio of the total cost of orders to a total amount of orders. |
| Avg. fuel consumption for an order | The ratio of the total amount of fuel consumed to a total amount of orders. |
| Avg. fuel consumption per order | The ratio of the total amount of consumed energy to the total number of orders. |
| Orders’ estimated mileage | The total distance calculated by the system for the delivery of orders. |
| Orders’ actual mileage | The total distance covered by a courier delivering orders. |
| Fuel consumed in orders | The total amount of fuel consumed while delivering orders. |
| Energy consumed in orders | The total amount of energy consumed during the delivery of orders. |
| Orders’ total weight | The overall weight of all created orders. |
| Orders’ total volume | The overall volume of all created orders. |
| Orders’ total cost | The overall cost of all created orders. |
Moreover, the following data may be included in the statistics for orders:
- Percentage of orders visited in time
- Percentage of orders visited late
- Percentage of non-visited orders
- Percentage of not visited but confirmed orders
- Percentage of visited but not confirmed orders
- Percentage of orders rejected
Rows in the “Statistics” table for other report types
If the report is executed not for the unit, then, depending on the type of the report template, the statistics include the data listed below.
| Report template type | Statistics data |
|---|---|
| Unit group | Statistics: Report; Group; Interval beginning; Interval end; Report execution time. |
| User | Statistics: Report; User; Interval beginning; Interval end; Report execution time; Logins: Time spent on site; Logins count. |
| Driver | Statistics: Report; Driver; Interval beginning; Interval end; Report execution time; |
| Trailer | Statistics: Report; Trailer; Interval beginning; Interval end; Report execution time. |
| Resource | Statistics: Report; Resource; Interval beginning; Interval end; Report execution time; SMS sent; SMS available. |
| Retranslator | Statistics: Report; Retranslator; Interval beginning; Interval end; Report execution time. |
| Route | Statistics: Report; Route; Interval beginning; Interval end; Report execution time. |
| Group of drivers | Assignments: In movement; Idling; Statistics: Report; Group of drivers; Interval beginning; Interval end; Report execution time. |
| Group of trailers | Statistics: Report; Group of trailers; Interval beginning; Interval end; Report execution time. |
| Passengers | Statistics: Report; Passenger; Interval beginning; Interval end; Report execution time. |
| Group of passengers | Statistics: Report; Group of passengers; Interval beginning; Interval end; Report execution time. |
The number of text messages that are displayed in the fields of the Resource template does not depend on the interval of report execution. The information is displayed for the period corresponding to the Reset option on the Services tab of the tariff billing properties.
As a rule, for all of the above points, you can make more detailed reports in the form of tables or charts.