System info
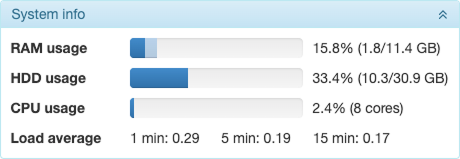
The System info section displays the usage of available memory and the average processor load.
| Parameter | Description |
|---|---|
| RAM usage | The amount of RAM in use. It is shown as a percentage in the x/y format, where x is the amount of memory used and y is its total amount. The process indicator for RAM simultaneously shows the data for the Used (darker color) and Cached values.If the indicator line turns red, it means that RAM utilization is over 90% and action needs to be taken. |
| HDD usage | The amount of disk space in use. It is shown as a percentage in the x/y format where x is the amount of the used space on the disk and y is its total volume.If the value of the used disk space reaches 90%, the indicator line turns red and the administrator receives an alert (the administrator’s email is specified on the System tab). In addition, if the critical level of free space (5 GB) is reached, the service stops automatically to avoid database corruption. In this case, the indicator line turns black and an email is also sent to the administrator. |
| CPU usage | The data on CPU usage (expressed as a percentage). The total number of cores of the installed processors is shown in parentheses. If the indicator line turns red, it means that CPU utilization is over 90% and action needs to be taken. |
| Load average | Server load indicator for the last 1/5/15 minutes. |