Reports
Reports in Wialon can be executed using previously created templates. The template contains information about the tables and charts that can be included in the report, as well as its settings.
Creating a report template
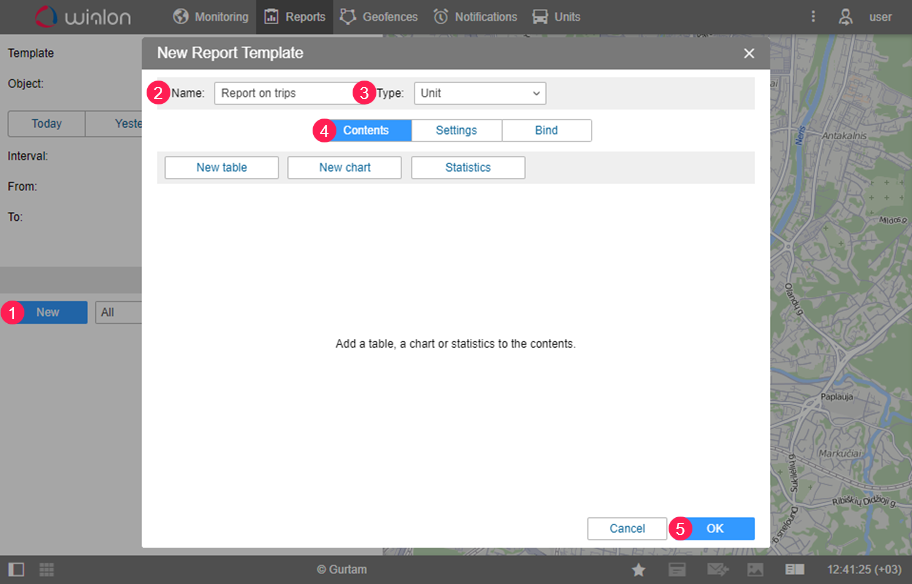
- Click Create (1).
- Specify the name of the report template (2).
- Select the type of the template (3).
- Add tables and/or charts on the Contents tab (4).
- Click ОК (5).
The sequence of actions when adding tables and charts to a report template is described below.
Adding a table
Each type of table has its own set of columns. You can add any number of tables to a template, including tables of the same type but with a different set of columns. The example below displays the creation of a table of the Trips type.
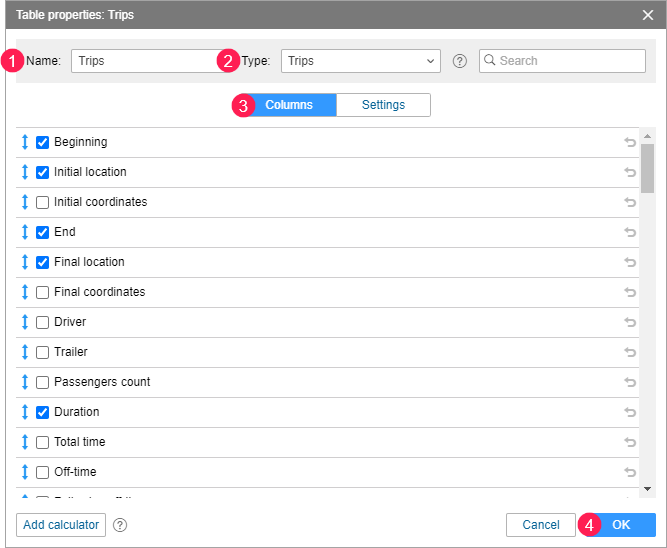
- Specify the name of the table (1).
- Select the (2) Trips type.
- Check the required columns (3). In this example, we mark the following columns: Beginning, Initial location, End, Final location, Duration.
- Click OK (4).
Adding a chart
Charts can be added only to the report of the Unit and User types. For the chart of the Regular type, the X-axis indicates time, while the indicators for the Y-axis are selected on the Data tab.
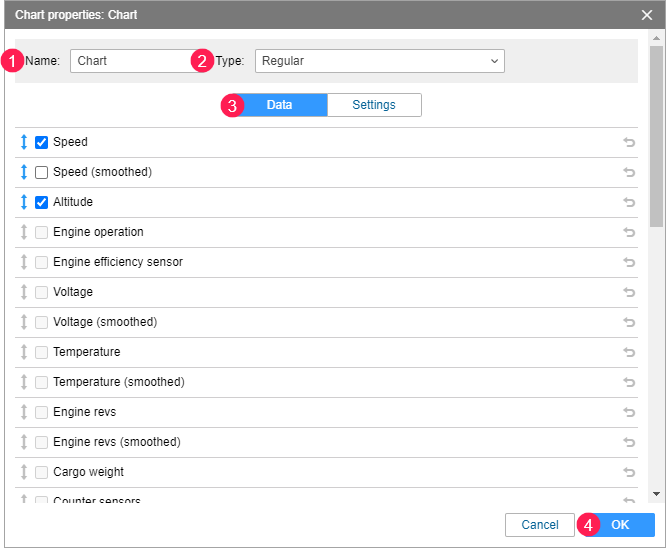
- Specify the name of the chart (1).
- Select the (2) Regular type.
- Check what kind of data (curves) should be displayed in the chart (3). In this example, we mark the following: Speed and Altitude.
- Click ОК.
The created report template appears in the Report templates section in the lower part of the workspace.
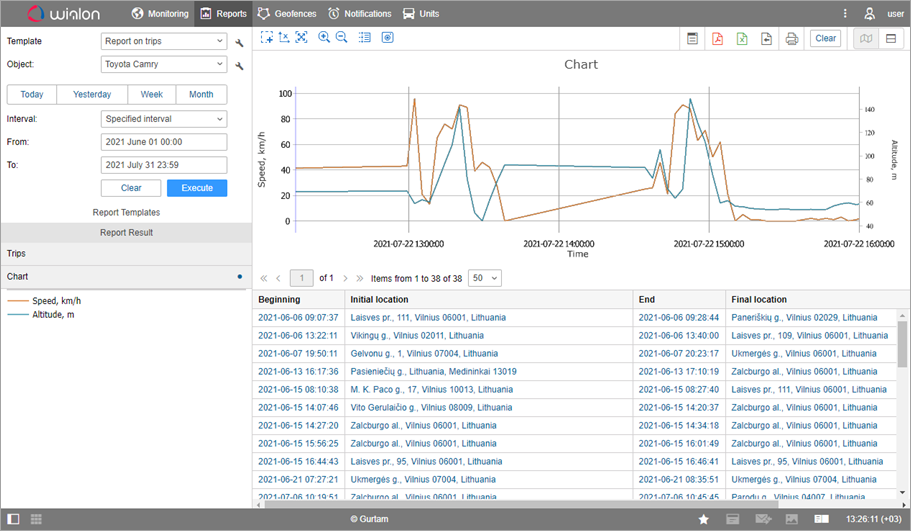
Executing a report
To execute the report on a unit, specify its parameters in accordance with the picture below.
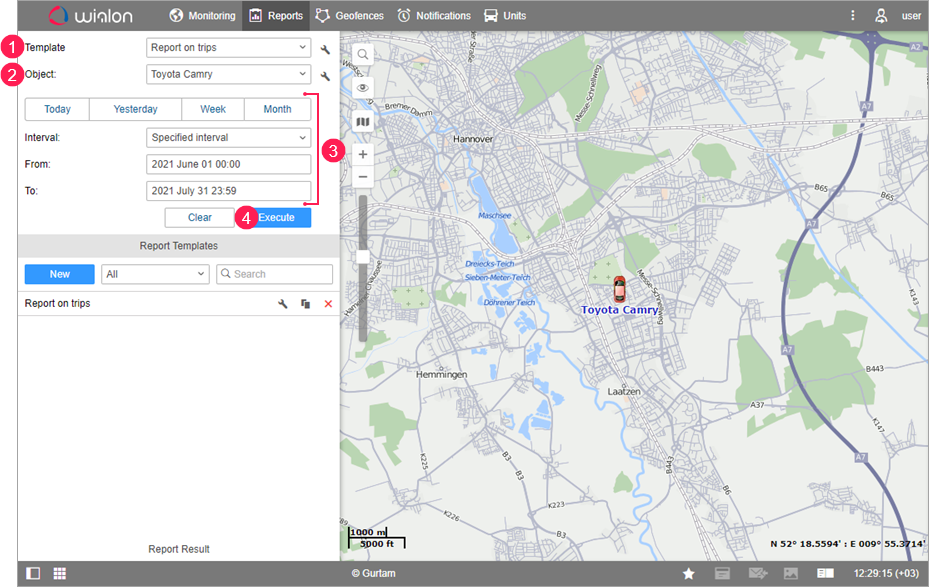
- Select the report template (1).
- Select the object of the report (2).
- Specify the time interval (3).
- Click Execute (4).
After the report is executed, the list of its contents appears in the Report result section. Click on the name of the table or chart to open the table or chart in the lower right part of the window. Click on the button  to activate viewing of two report windows. In our example, both the table and the chart are shown simultaneously.
You can export the resulting report to a file ( ) in the HTML, PDF, Еxcel, XML, CSV format or print (
 ).
).