Dashboard
The Dashboard tab contains summary information about the units from the work list. Here you can quickly assess the status of devices installed on the units, see unit connection and motion state, view the latest online notifications as well as the geofences where the units are located, and so on. The information is updated as new messages are received from the units.
To open the Dashboard tab, click on the same name item in the top panel. The tab is displayed if the Dashboard item is selected in the main menu settings.
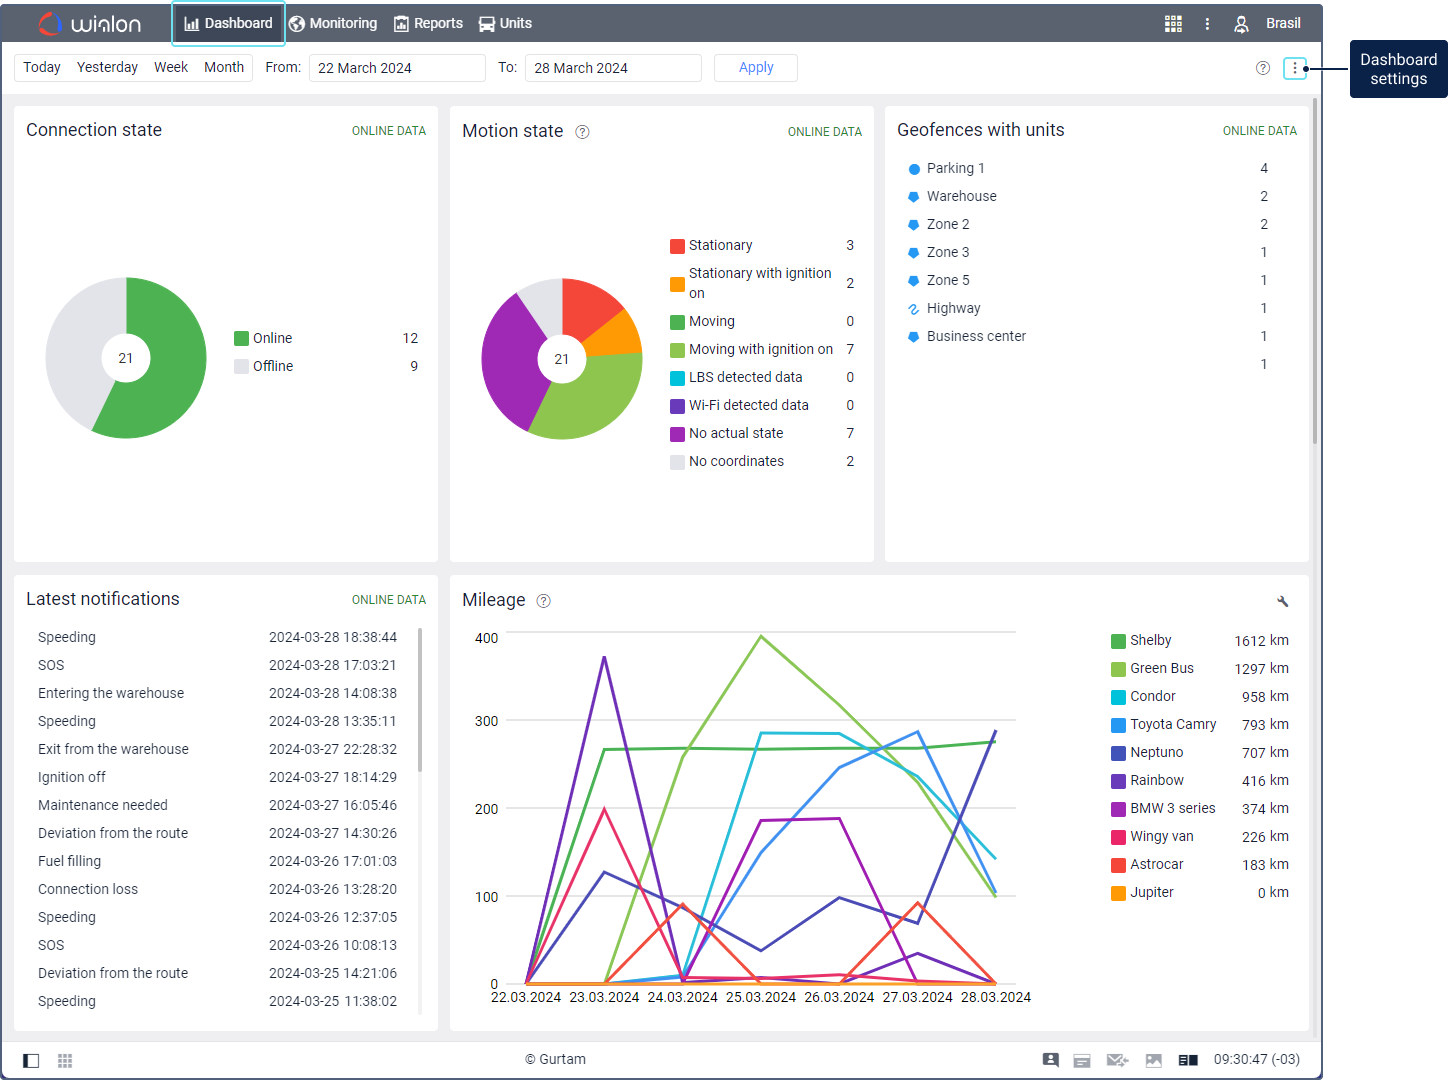
The Dasboard tab offers 19 information blocks. In the Dashboard settings ( ), you can select the blocks which should be displayed. You can change their order by clicking on the heading of the block and dragging it to the required place.
Blocks with real-time data
The blocks listed below display data in real time. This means that you can’t request historical data for these blocks on the Dashboard tab.
- Health check status
- Connection status
- Motion state
- Geofences with units
- Latest notifications
- Device battery level
- Voltage level
- Number of messages per hour
- Distance between messages
- Fuel data changes
- Ignition state
- GPS data
- Number of satellites
- Messages
Blocks with historical data
The Mileage, Consumed by FLS, and Speedings blocks display information for the last seven days by default. To see data for another time period, complete the Interval fields with its beginning and end manually or using the calendar, and click Apply. To see data for a certain day, specify it as the interval beginning and end. Besides, you can select one of the preset intervals: today, yesterday, week, month. Every time you sign in, the default interval is applied.
Monitoring the device state on the Dashboard
You can monitor the state of the devices installed on the units in real time in the Health check status block and individual blocks for each health check criterion. Historical data about device status is available in the Health check incidents table.
“Health check status” block
This block summarizes the overall health of your devices, depending on whether they meet the criteria configured on the Health check tab of the unit properties.

They unit devices can fall into one of the following categories:
| Category | Description |
|---|---|
| Healthy | The device doesn’t meet any of the configured criteria. The Healthy category also includes the devices for which no criteria are tracked, if their units are added to the work list. |
| Need attention | The device meets one or more criteria for which a tracking period is selected. |
| Unhealthy | The device meets all the configured criteria. |
Individual criterion blocks
Each individual criterion block requires the corresponding criterion to be configured on the Health check tab of the unit properties. The following real-time data is displayed in the blocks.
| Block | Description |
|---|---|
| Device battery level | Provides information about the battery charge of the devices installed on the units. |
| Voltage level | Allows you to track deviations from the specified voltage range for device batteries, the unit onboard network, or other voltage sources. |
| Number of messages per hour | Allows you to track the frequency of messages sent by devices. |
| Distance between messages | Allows you to track coordinate outliers in messages from devices. |
| Fuel data changes | Allows you to track malfunctions in fuel level sensors. It displays devices with and without fuel level changes. |
| Ignition state | Allows you to track the ignition state of units. It shows units with the ignition off and on. |
| GPS data | Allows you to track which units have stopped sending GPS coordinates. |
| Number of satellites | Provides information about the units whose location may be determined incorrectly due to an insufficient number of satellites. |
| Messages | Provides information about the units that have stopped sending messages. |
Interacting with health check blocks
All health check blocks contain a pie chart.
In the individual criterion blocks, devices are divided into categories indicated with green and red colors. Green indicates devices without incidents based on the health check criteria, while red indicates devices experiencing incidents in real time. The Health check status block also includes a third category, represented in orange, for devices that require attention.
When you hover over a sector of the chart, the percentage of the total number of devices that belong to the category is shown. To the right of the chart is a legend indicating which category each color represents and the corresponding number of devices.
To see which devices belong to a category, click on it in the legend. In the list of devices with incidents, hovering over a row shows which criteria the device currently meets.
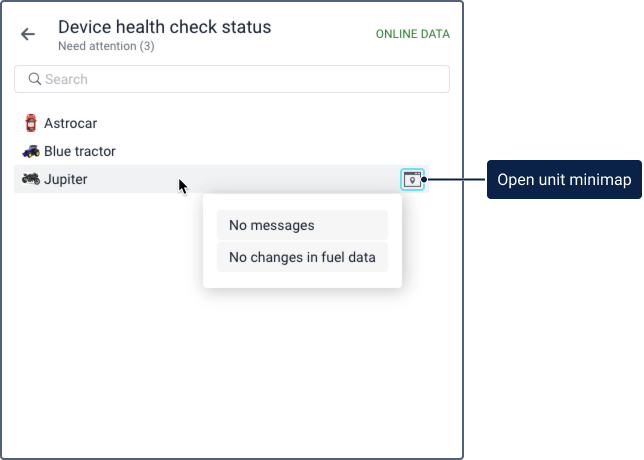
To open the unit minimap, click on the icon  in the row of the required unit.
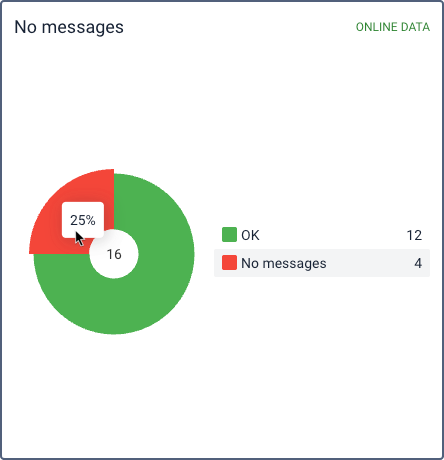
Connection status
This block contains a pie chart with information about the connection status of the units: online or offline. To the right of the chart is its legend, which shows what category is represented by each color and how many units belong to it. When you point to a sector of the chart, a percentage of units belonging to this category is displayed.
To see the list of units belonging to the category, click on it in the legend.
To quickly find units by name, use the dynamic search above the list. Click on the line with the unit to open its minimap.
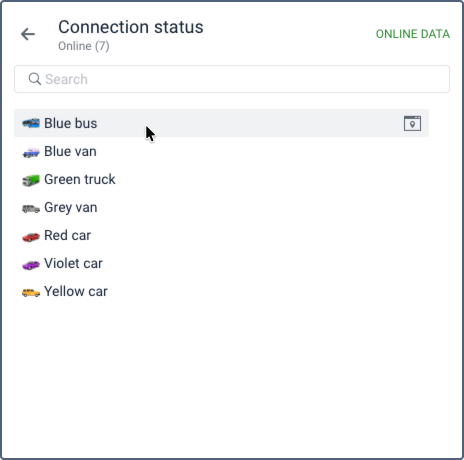
Motion state
This block contains a pie chart with the information about the motion state of units. The chart legend shows what category is represented by each color and how many units belong to it. When you point to a sector of the chart, a percentage of units belonging to this category is displayed.
To see the list of units belonging to the category, click on it in the legend. Above the list is a dynamic search to find units by name. Click on the line with the unit to open its minimap.
Geofences with units
The block is displayed if the Presence in geofences option is activated in the user settings. It shows a list of geofences where the units are located at the moment. The following information is indicated for each geofence: type (graphically), name and the number of units.
Click on the geofence name to see the list of all the units located in it. Above the list is a dynamic search to find units by name. Click on the line with the unit to open its minimap.
Latest notifications
The block shows the latest online notifications as well as the date and time they were received. To open a notification, click on its name.
Mileage
This block contains a line chart with the data on the mileage of units for the specified interval (seven days by default). If the interval exceeds 14 days, the data in the chart is grouped. If it includes only one day, dots are displayed instead of lines.
The chart legend shows the mileage of the unit and the color that corresponds to it. If you point to the unit in the legend, its line in the chart remains colored while the others become grey. When you point to the part of the chart corresponding to one day, you can see a tooltip with the data on the unit mileage for that day.
By default, the chart shows data on the first 10 units from the work list. To change them, click on the icon  and select the required ones (no more than 10). To quickly find units, use the dynamic search. Then click on the icon
 ![]() to go to the chart. When you sign in the next time, the same units remain selected.
to go to the chart. When you sign in the next time, the same units remain selected.
Consumed by FLS
The line chart of this block displays how much fuel was consumed by units and detected by the fuel level sensor (FLS) for the specified interval (seven days by default). If the interval exceeds 14 days, the data in the chart is grouped. If it includes only one day, dots are displayed instead of lines.
The chart legend shows the volume of fuel consumed by the unit and the color that corresponds to it. If the unit has more than one FLS, the sum of their values is indicated. If you point to the unit in the legend, its line in the chart remains colored while the others become grey. To see how much fuel was consumed by the units on a certain day, point to the part of the chart corresponding to this day.
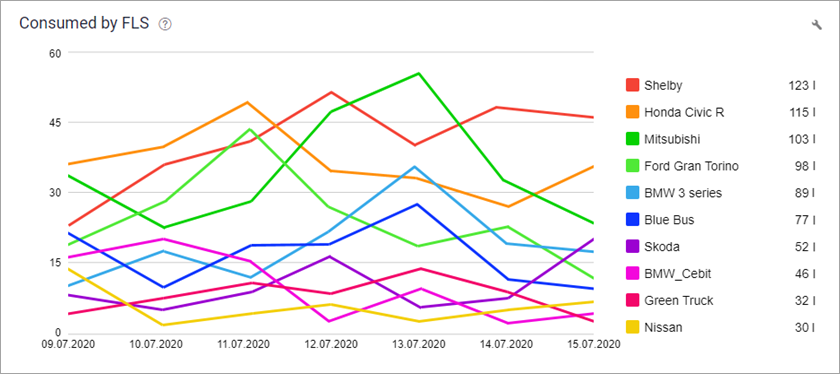
By default, the chart shows data on the first 10 units from the work list. To change them, click on the icon and select the required ones (no more than 10). To quickly find units, use the dynamic search. Then click on the icon ![]() to go to the chart. When you sign in the next time, the same units remain selected.
to go to the chart. When you sign in the next time, the same units remain selected.
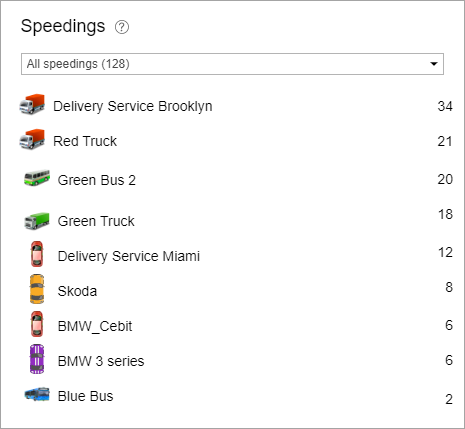
Speedings
This block contains the list of units for which speed limit violations have been detected for the specified interval (seven days by default). Opposite the name of the unit, by default, the number of all its violations is shown. To filter them, select the necessary range of values in the drop-down list in the upper part of the block. For example, you can display the number of violations where the speed limit was exceeded by 10 to 20 km/h.
To see the violations of the unit in this block, the Road limits method of speeding detection should be selected on the Advanced tab of the unit properties.
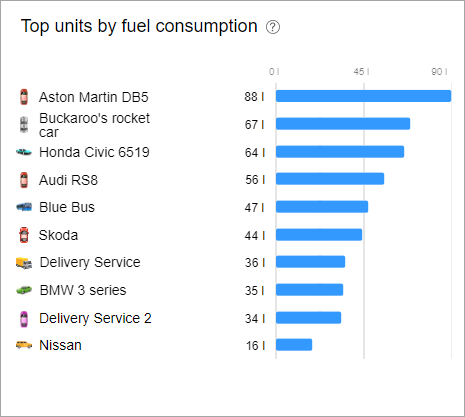
Top units by fuel consumption
The block displays units with the maximum fuel consumption detected by FLS for the specified interval (seven days by default). The volume of fuel consumed by the unit is shown opposite its name and is additionally displayed in the horizontal chart on the right.
Top units by mileage
The block displays units with the maximum mileage for the specified interval (seven days by default). The mileage of the unit is shown opposite its name and is additionally displayed in the horizontal chart on the right.
Video: Dashboard tab
You can find information about the Dashboard tab in the following video dated 02.10.2020: