Reports
With the help of reports, you can combine and analyze all available data about units, drivers and other system objects in a form that is convenient for you.
The reports module helps to solve, among other things, the following tasks:
- control over the movement of vehicles (trips, stops, parking);
- control over visits to certain sections on the map (geofences) or points of the planned route;
- collection of statistics on mileage, number of engine hours, counters and sensors readings of vehicles and equipment;
- analysis of data on fuel consumption, detection of potential fuel drains;
- control over driving safety, analysis of driving style, detection of speeding and other violations of the driver;
- recording the working hours of drivers, boarding and disembarking passengers from the vehicle;
- control over the maintenance intervals and the cost of utilization and maintaining the fleet;
- unloading of correspondence between the operator and the driver, sent commands, photo and video files.
Report Configuration Options
The flexibility of report settings allows you to adapt them to different requirements. The main features of making a report are listed below.
- Reports can be executed for different system objects: a unit, a group of units, a driver, a group of drivers, a user, a geofence, etc.
- Reports can include the following components: tables, charts, statistics, a map with tracks marked on it and markers of stops, fuel filling and other actions with the unit.
- The monitoring system has more than 40 report tables. Each table has additional settings: selecting columns and changing their names, formatting, filtering, sorting and grouping data, etc.
- The created report is stored as a template containing all its parts (tables, charts) and settings. When executing reports of the same type, you do not need to specify all the settings again each time.
- Completed reports can be viewed online, saved to files of various formats, or printed.
- You can automate the execution of reports and sending them to email with a notification or job.
Report components
A report can include the following parts:
| Component | Description |
|---|---|
| Table | The main report component. Each type of table has its own set of available columns. You can also save your own settings for each table: the number of columns and their names, grouping, filtering and sorting data within the table, etc. Check the list of tables. |
| Chart | A tool for data visualization and analysis. The chart can present such data as fuel consumption according to the FLS and according to the norm, vehicle speed, temperature, values of sensors and counters, etc. |
| Statistics | A table containing data about the report itself (interval, execution time, number of processed messages, etc.) and summary indicators for mileage, hours, fuel consumption, violations, orders, etc. |
| Map | A map attached to the report, which can show the unit tracks and markers in the places where something happened to the unit. |
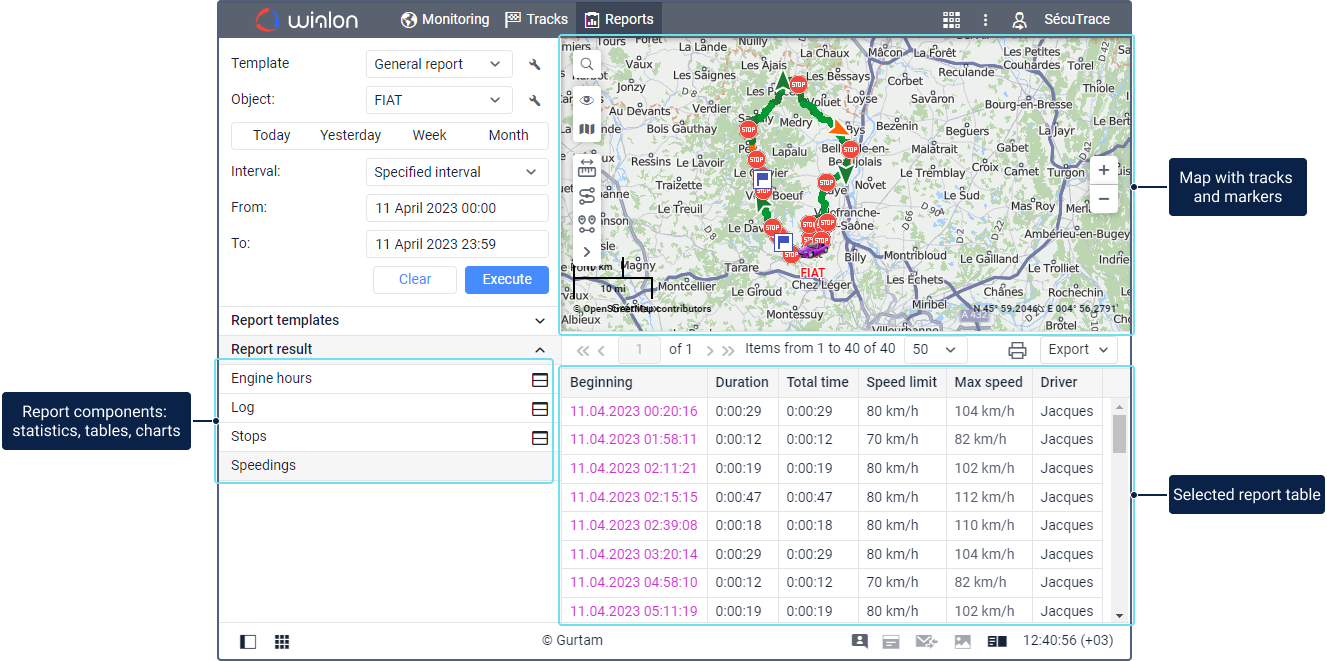
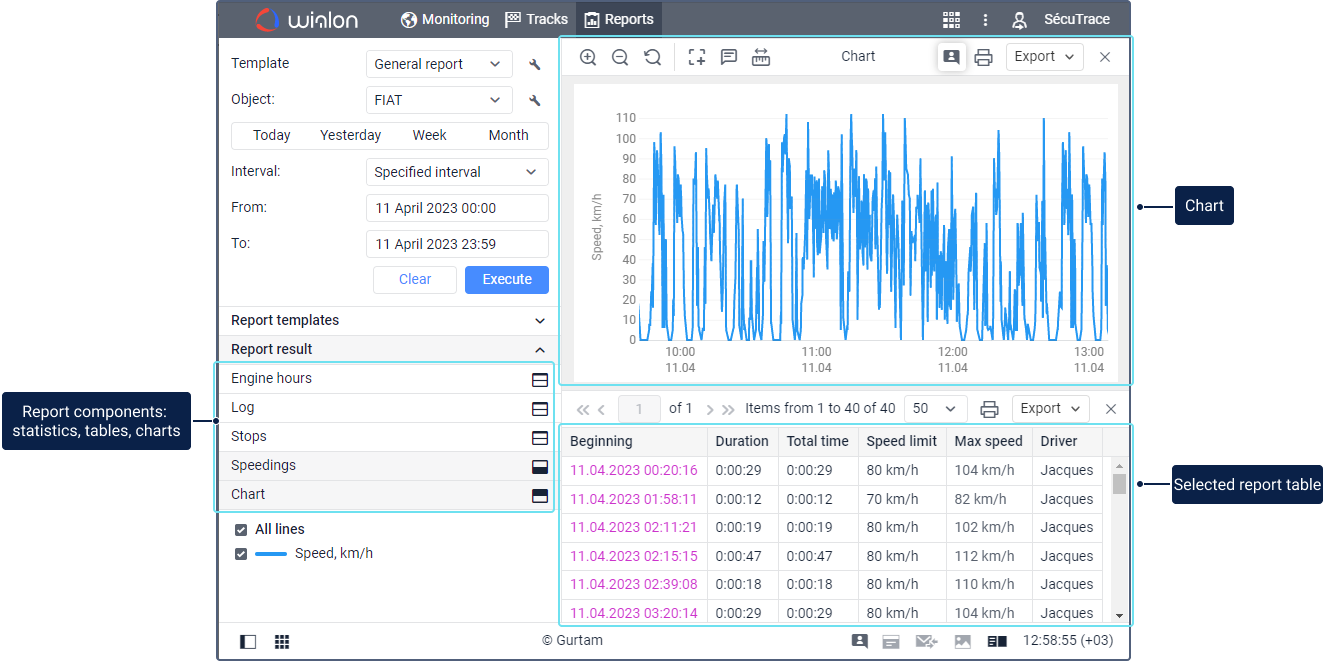
Below are the components of the report executed in the monitoring system. It includes several tables, a chart, a map with tracks and markers.
The image shows one of the report tables (Speeding) and a map.

The image below shows the same table and the speed chart.

Video: Reports tab. Creation
You can learn how to create report templates in the following video dated 11.03.2020:
Video: Reports tab. Execution
You can learn how to execute reports in the following video dated 11.03.2020:
Video: Reports tab. Reading
Find out more about viewing reports in the following video dated 11.03.2020: