Statistics
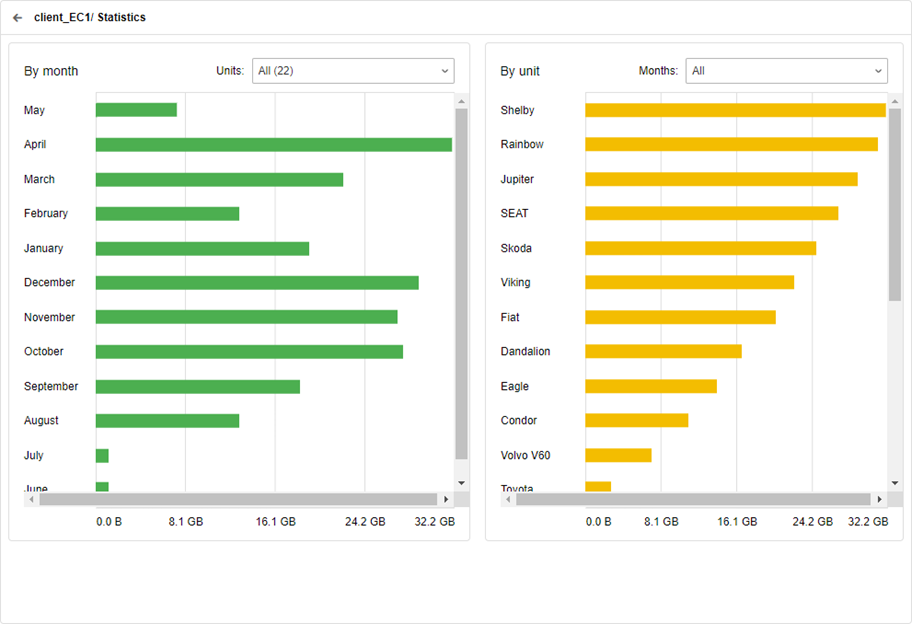
For every account, you can see statistics on traffic usage. To do this, click Statistics above the unit table. The window displays two charts: by month and by unit.
To return to the unit table, click on the icon ![]() .
.
Chart by month
This chart shows statistics on traffic usage by month. The data is displayed for the last 12 months. Next to the name of each month, the amount of the used traffic is shown as a green bar. Click on a bar to go to the chart of traffic usage by day. It displays data for each day of the selected month. After clicking on a bar corresponding to any day, you can see a chart of traffic usage by hour.
In the bar tooltip, you can see the exact amount of traffic used during this time. By default, the traffic of all the units is taken into account, however, if you want to display the data of a specific unit, select it in the drop-down list above the chart.
Chart by unit
This chart shows statistics on traffic usage by unit over the last 12 months. If you want to display data for a specific month, select it in the drop-down list above the chart.
The amount of the used traffic is shown as a yellow bar next to the name of each unit. Click on a bar to go to the chart of traffic usage by day. It displays data for each day of the selected month or, if All is selected in the list, for each day of the current month. After clicking on a bar corresponding to any day, you can see a chart of traffic usage by hour.
In the bar tooltip, you can see the exact amount of traffic used during this time. The charts by day and by hour show the data of the selected unit, however, you can select another unit in the Units drop-down list above the chart.