Configuring maintenance widgets for Dashboard
Who can do it: Service provider
Where: Wialon Platform FleetSpace
Wialon Platform FleetSpace offers widgets that display relevant maintenance information.
- Log in as a customer to Wialon Platform FleetSpace.
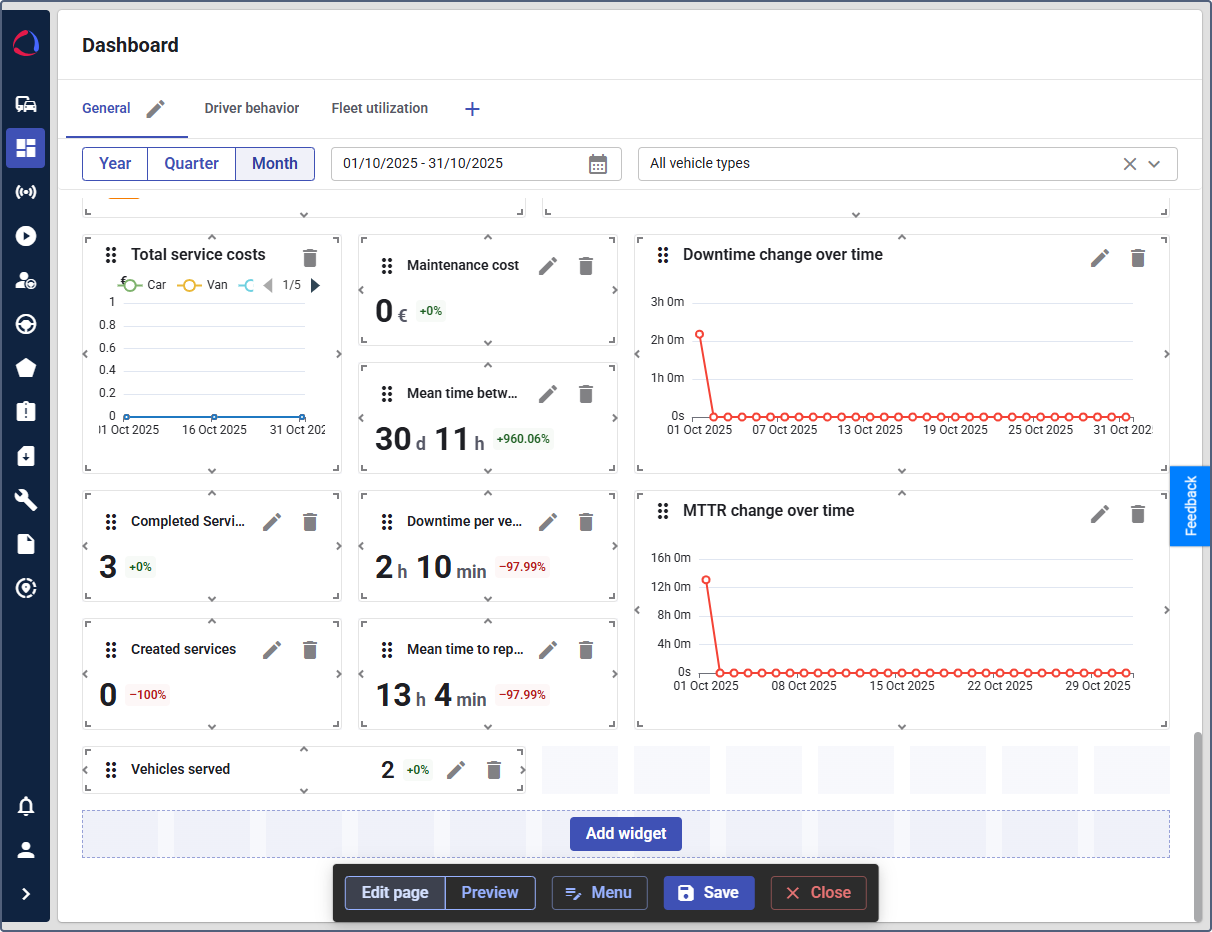
- Navigate to the Dashboard page.
- Click the icon
 in the sidebar to enable the editor mode.
 - Click the Add widget button.
- In the panel on the right side of the screen, locate the maintenance template to display widgets related to vehicle maintenance.
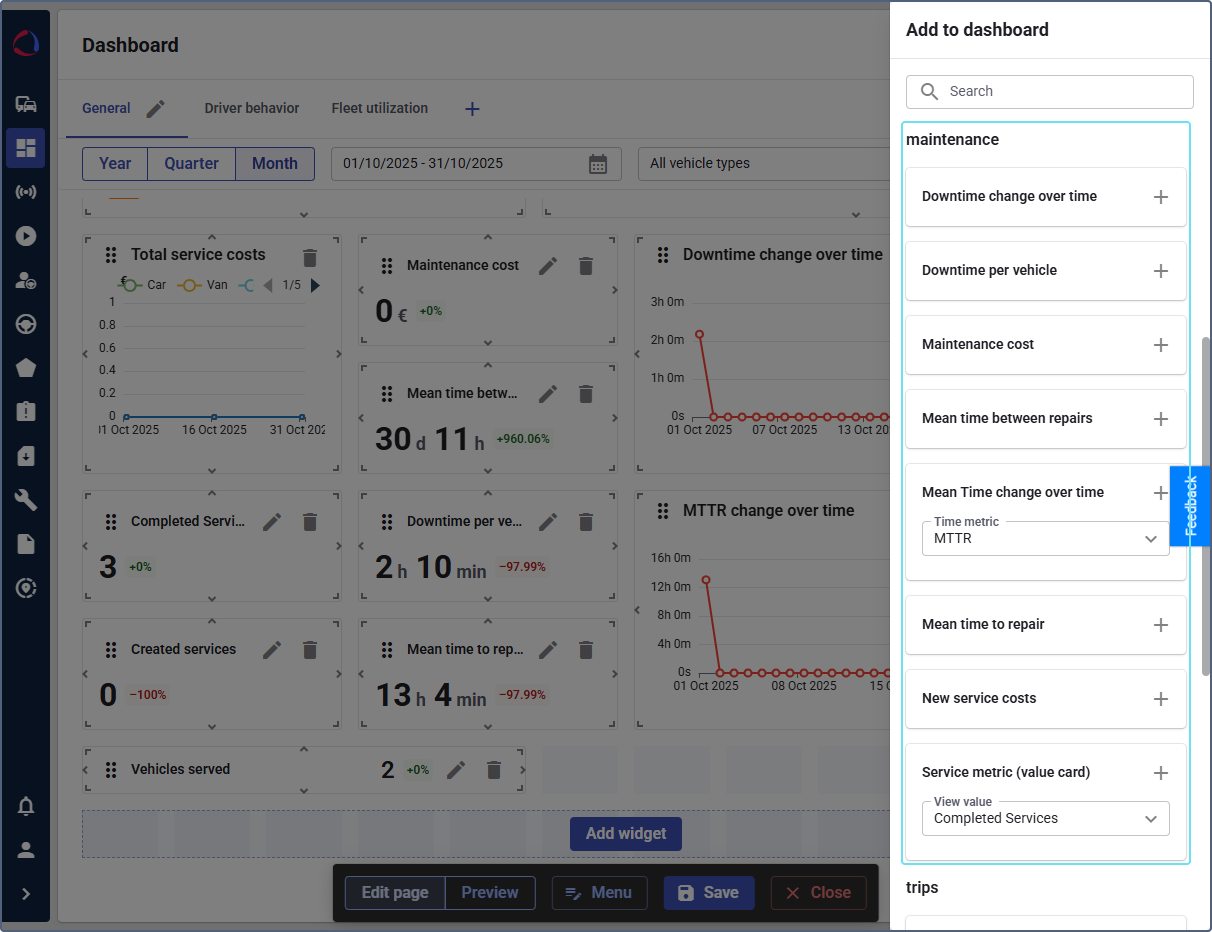
- To add a widget, click the icon
 next to its name.
Available maintenance widgets
- Created services: Displays the total number of created services. Click the widget to see created service details: device, service name, priority, and creation date and time. You can also go to the Maintenance page from the details.
- Downtime change over time: Displays the total downtime of devices over time. Click a chart point for the details: device name, service name, downtime duration, and the service status. You can also go to the Maintenance page from the details.
- Downtime per vehicle: Displays the average downtime per device. Click on the widget to view the total and the longest downtime for each device, as well as the number of services performed on it. You can also go to the Maintenance page from the details.
- Maintenance cost: Displays the total cost of all completed maintenance services for a selected time period for the selected devices. It also shows a comparison with the previous period. Click on the widget to view the total service cost and number of services for each device.
- Mean repair duration change over time (line chart): Displays the trend of the average time spent on maintenance. To configure the widget, use the View value dropdown to select one of the following metrics:
- Mean time to repair: The average time a vehicle spends being actively repaired (in the In progress status). A lower value indicates faster repairs.
- Mean time between repairs: The average operational time between repairs. A higher value indicates a more reliable fleet. Click a chart point to see the details. For the Mean time to repair, the details include device name, service name, service creation and completion dates, as well as the repair duration. You can also go to the Maintenance page from the details. For the Mean time between repairs, the details include device name, last and previous repair times, as well as the interval between them.
- Mean time between repairs: Displays the average time between repairs. Click on the widget to view the last repair date and how many days have passed since then.
- Mean time to repair: Displays the average time it takes to repair a vehicle. Click on the widget to view the details: device name, service name, service creation and completion dates, as well as the repair duration. You can also go to the Maintenance page from the details.
- New service costs: Displays the cost of new services. Click a chart bar to see the devices for which services were carried out on the selected day, as well as their cost and priority. You can also go to the Maintenance page from the details.
- Service costs by device (list): Displays the maintenance cost for each device. Click a device row to view each service cost and downtime caused by it. You can also go to the Maintenance page from the details.
- Services metric (value card): Displays the number of completed services or vehicles served depending on the selected option in the View value field. Click the widget to view the details. For the Completed services option, the details include device name, service name, cost and completion date. For the Vehicles served option, the details include device name, the number of completed and rejected services, and the total cost. You can also go to the Maintenance page from the details.
- Total service costs: Displays the total cost of all services over time, color-coded by vehicle type. Click a chart point to view which vehicle types had services in the that period, how many services were done, and the total cost . You can also go to the Maintenance page from the details.
In all widget details views, you can sort the data by clicking a column header and download it in CSV format.