Configuring the “Parameter monitoring” page
Who can do it: Service provider
Where: Wialon Platform FleetSpace
The parameter monitoring page displays the real-time status and data for several devices. It gives a quick overview of the devices and highlights any potential issues.
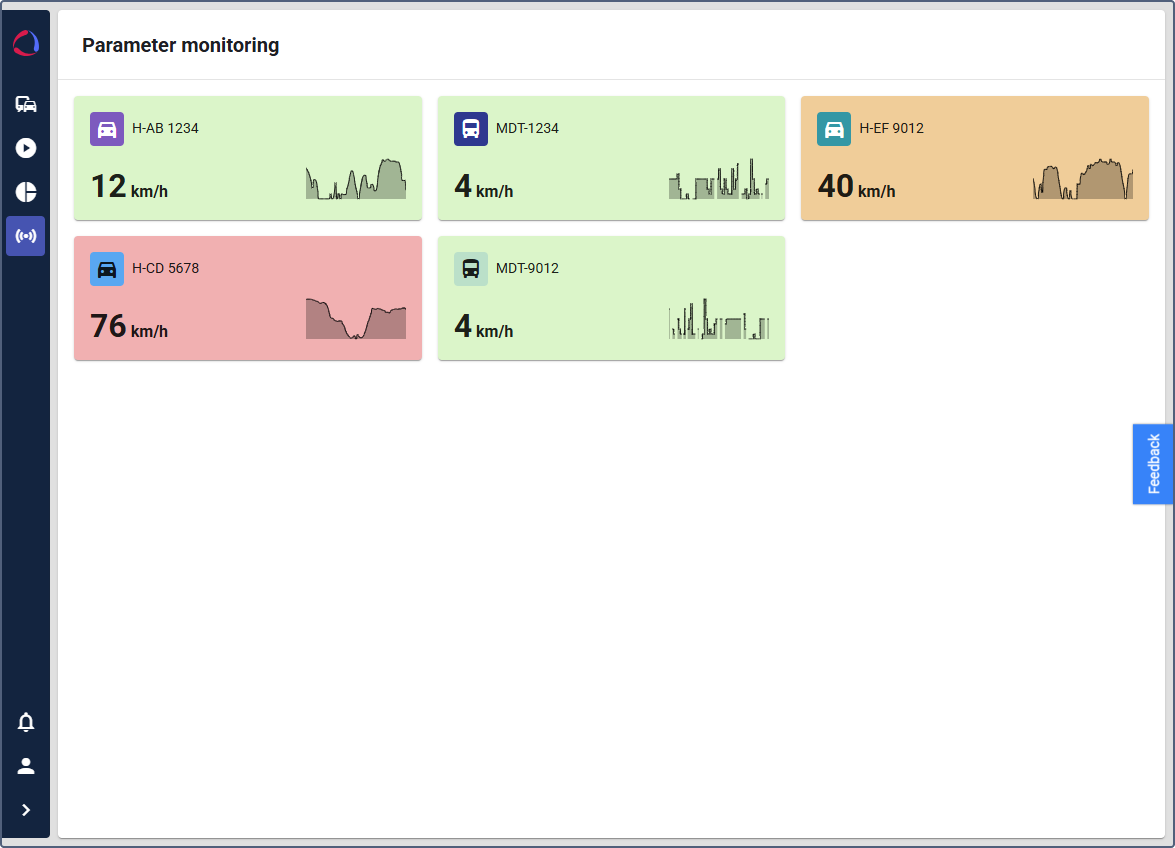
The page has two views: the tile view and the detailed view. In the tile view, you can monitor one parameter for each device. Tap on a specific device to see the detailed view.
Adding the page
To add the Parameter monitoring page to your customer interface using the editor mode:
- Log in as a customer to Wialon Platform FleetSpace.
- Click the icon
 to enable the editor mode.
 - If the sidebar is collapsed, expand it using the icon
 .
. - Click New page in the sidebar.
- In the Add page window, click Source page.
- Select Parameter monitoring.
- Give the new page a custom title and an icon, if necessary.
Now you are ready to customize the information displayed on the page.
Customizing the tile view
To configure the information displayed in the tile view:
-
In the editor mode, click on a tile.
-
In the appearing Parameter monitoring page window, in the Label field, enter a user-friendly name for the parameter being monitored, for example,
Speed. -
In the Time range (hours) field, define the time period for the small graph on the tiles. For example,
5will show the speed information for the last 5 hours. -
In the Unit of measurement field, enter the unit of the parameter for example,
km/h. -
In the Parameter system name, enter the system name of the parameter you want to display, for example,
position.speed.You can access the names of device parameters on the Messages tab. To do this, go to the Devices tab, select the necessary device and go to the Messages tab. The list of recent parameters is displayed on the right.
-
(Optional): Complete the Thresholds section: Define value ranges for the parameter and assign a specific color to each range.
- Click the icon
 to add a new threshold.
 - Enter a numerical value for the threshold.
- Click the colored box to choose a color for the range. The device tiles will display this color when the parameter’s value falls within the defined range.
- Click the icon
-
Toggle the Show chart option to display or hide the small graph on the device tiles.
-
After configuring all the settings, click the button
 in the editor mode toolbar to add the new page to your navigation.
Now you can monitor the current speed of your devices and see how it changed for the last 5 hours.
See how to add widgets and customize the information displayed in the detailed view on the Adding widgets for parameter monitoring page.