Enabling trip chips and widgets
Who can do it: Service provider
Where: Wialon Platform FleetSpace
To display trip-related information in Wialon Platform FleetSpace, you can configure relevant widgets on the Devices, Drivers online, and Dashboard pages.
Trip information on the “Devices” page
To configure trip chips on the Devices page:
-
Log in to Wialon Platform FleetSpace.
-
Open the Devices page.
-
Click the icon
 in the sidebar to enable the editor mode.
 -
Click on the device list.
-
Click Add widget.
-
In the Available widgets list, click the icon
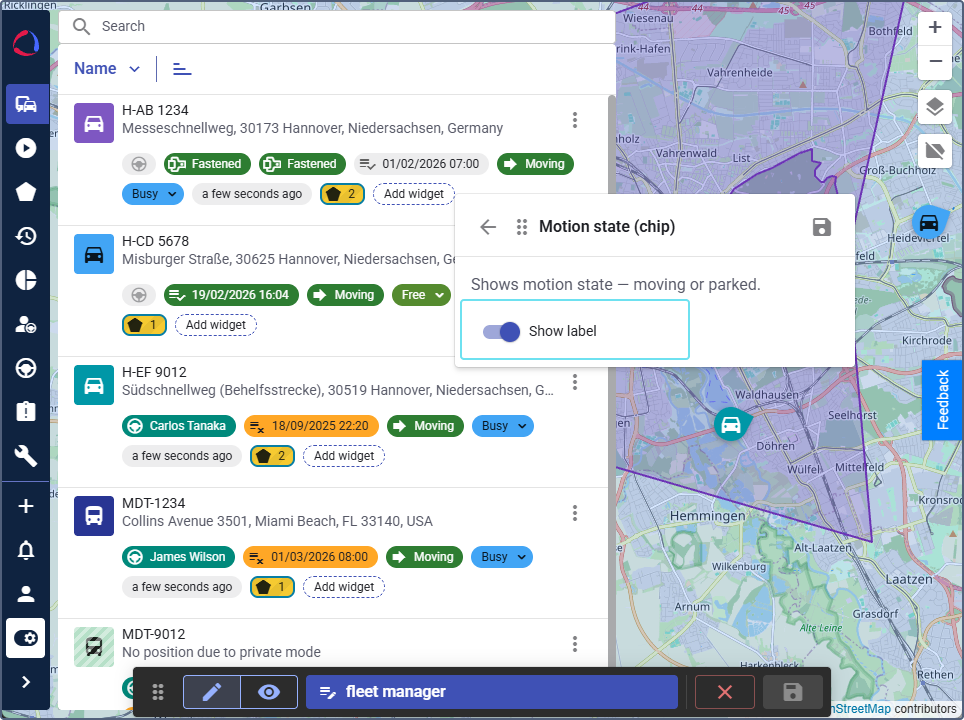
 next to the trip chips (Motion state, Connection state) to add them to your Devices page layout.
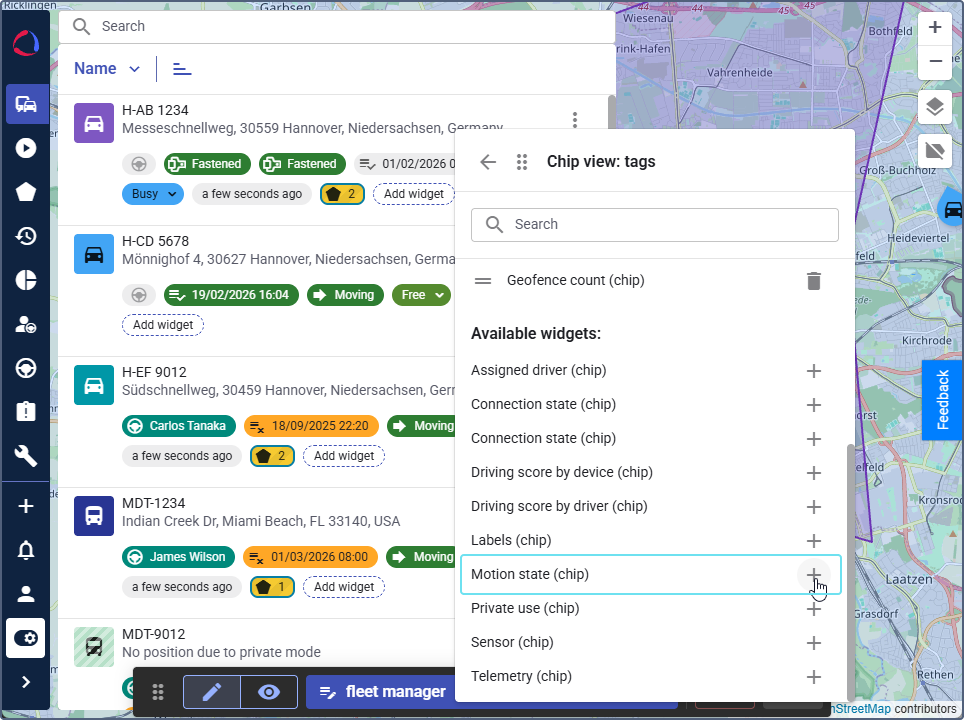
-
Enable the display of the chip label, if you want to see the name of the chip besides its icon.
-
Click the icon
 .
.
Trip information in the device details
To view trip information in the device details, you can add the following widgets:
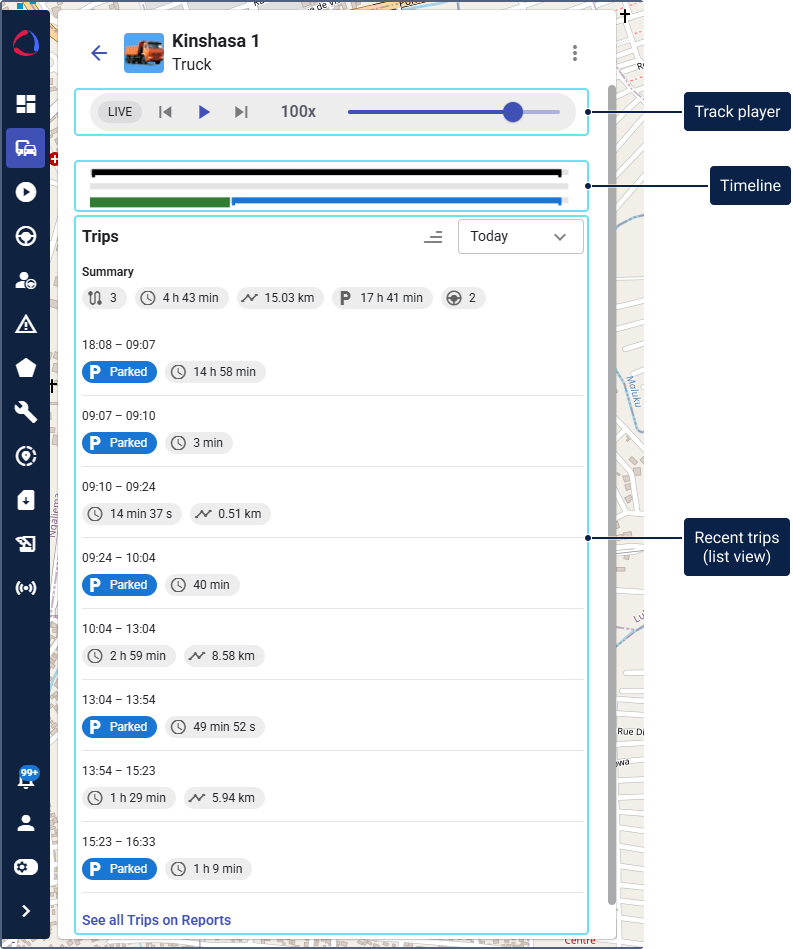
- Timeline: Allows you to see up to 3 data types on the timeline in real time (trips and parking intervals, connection losses, violations, and so on).
- Track player: Allows viewing vehicle tracks in real time and for the recent trip period
- Recent trips (card and list view): Provides information about recent trips and parking intervals.
Timeline
To configure the Timeline widget in the device details:
-
Log in to Wialon Platform FleetSpace.
-
Open the Devices page.
-
Click on any device section to open the device details.
-
Click the icon
in the sidebar to enable the editor mode. -
Click Add widget in the device details.
-
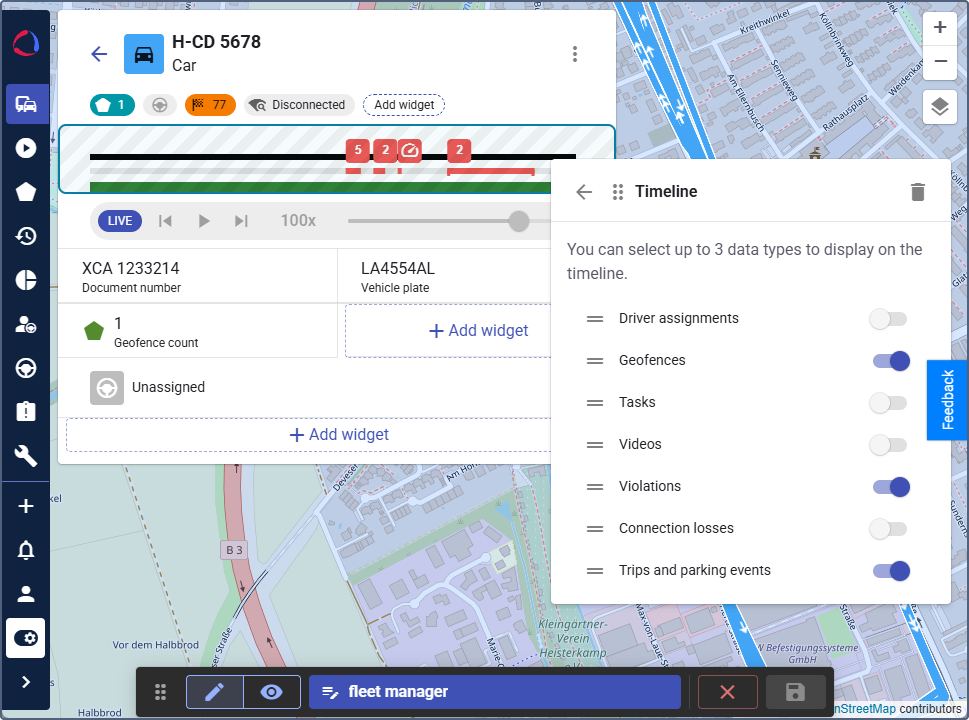
Select the Timeline widget from the list of available ones.
-
Select the data you want to display on the timeline. You can select up to 3 data types from the available ones.
-
Arrange the selected types in the required order by dragging and dropping them.
-
Click the icon
in the widget settings to apply the changes to all devices. -
Click the button
in the editor mode toolbar to save the updated workspace.
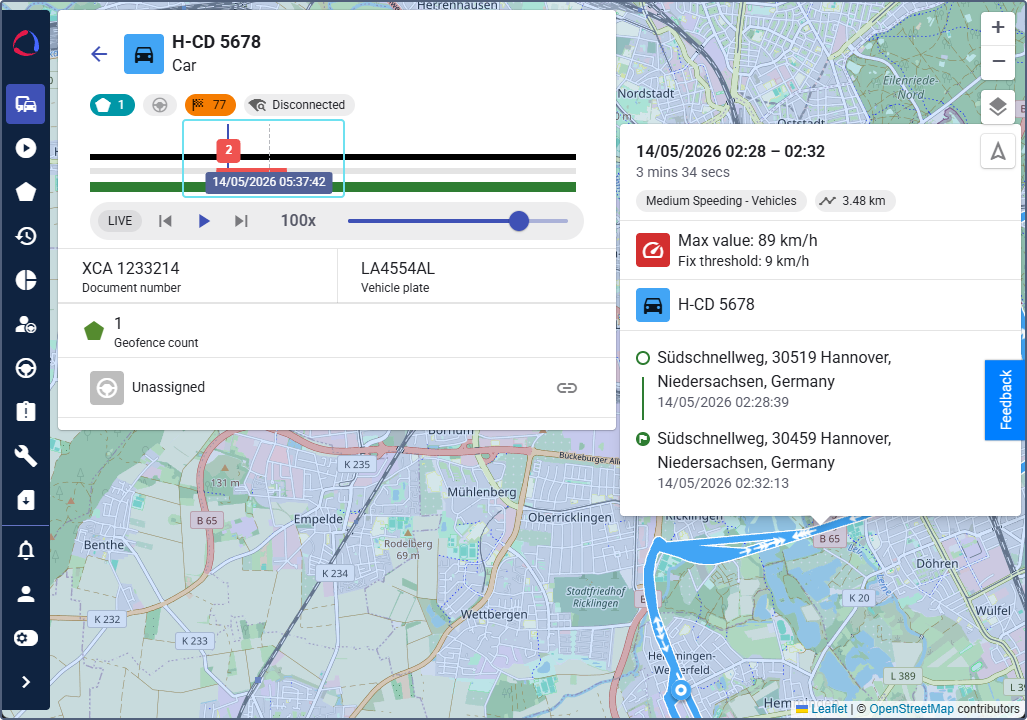
If the Timeline widget is configured to display violations (step 7), they are indicated with markers on the timeline. Click on the marker to see the violation and its tooltip on the map.
Track player
To configure the Track player widget in the device details:
-
Follow steps 1–5 from the above guide on configuring the Timeline widget.
-
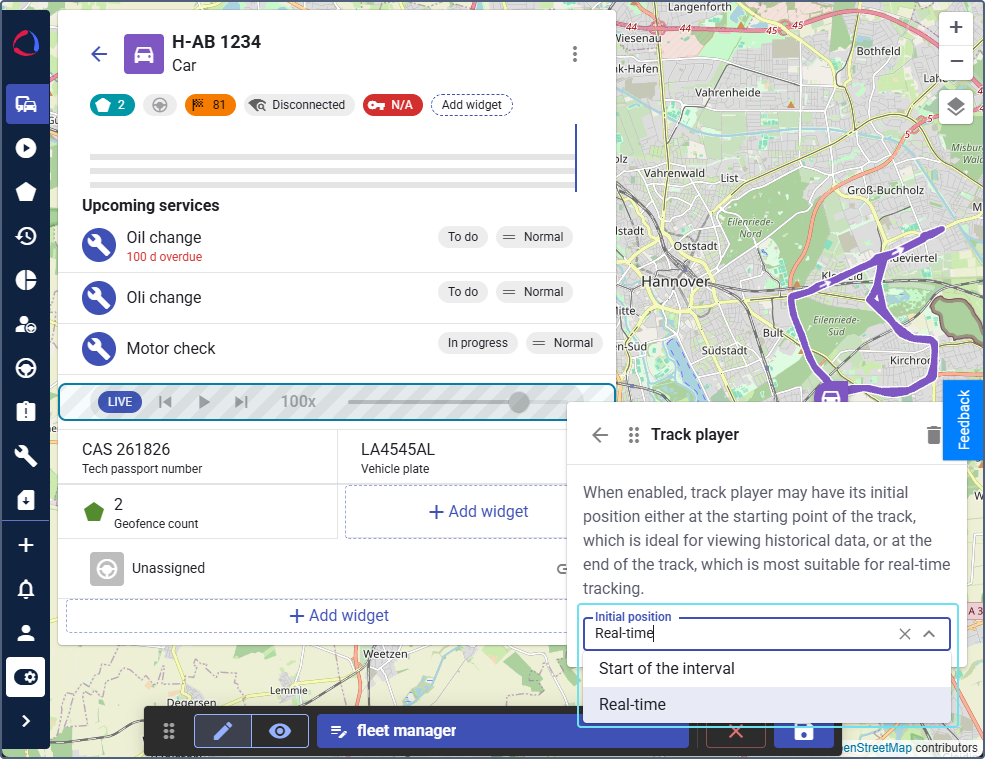
Select the Track player widget from the list of available ones.
-
In the Initial position field, select Real-time if you want to play tracks in real time, or Start of the interval if you want to play the last track from the beginning.
-
Click the icon
to apply the changes to all the devices. -
Click the button
in the editor mode toolbar to save the updated workspace.
Using the Track player widget is similar to working with the same tool on the Track player page. Open the device details to view its track in real time. Click any point on the track to start playback from that moment.
Recent trips
To configure the Recent trips (card and list view) widget in the device details:
-
Follow steps 1–5 from the guide on configuring the Timeline widget.
-
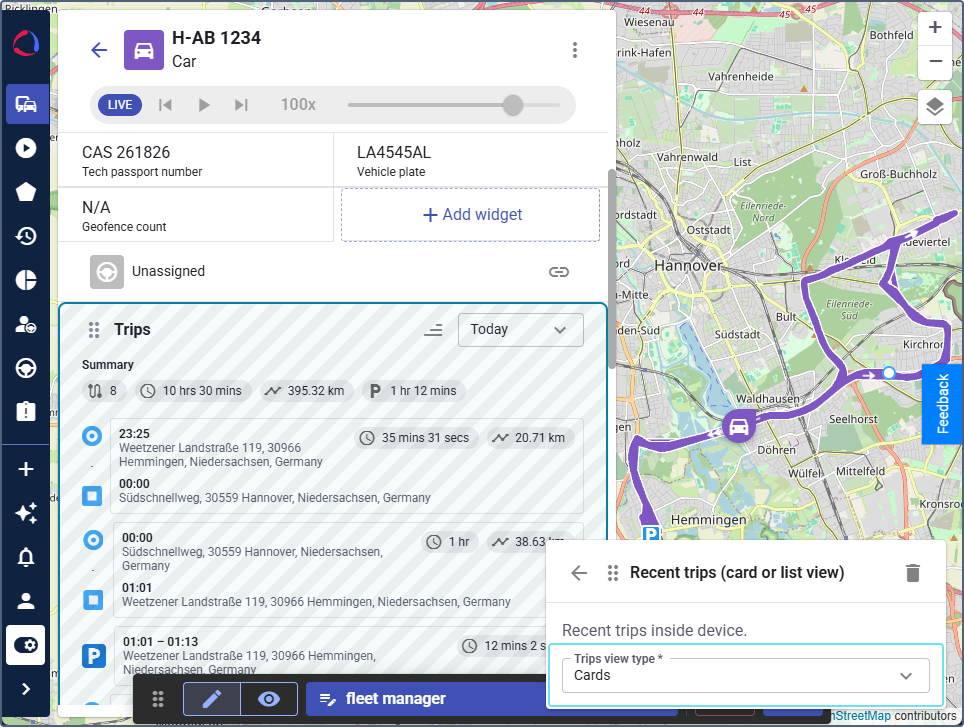
Select the Recent trips (card and list view) widget from the list of available ones.
-
In the Trips view type field, select whether you want trips and parking intervals to be displayed as individual cards or in a list.
-
Click the icon
to apply the changes to all the devices. -
Click the button
in the editor mode toolbar to save the updated workspace.
Trip information in the driver details
You can configure the following trip-related widgets in the driver details: Driver timeline, Track player, Recent trips. They work in a similar way as the same device widgets described above. For driver widget configuration, see Customizing driver profile view.
Trip information on the “Dashboard” page
On the Dashboard page, you can configure the following trip charts and metrics:
- Devices with no data for 30 days
- Trip mileage vs. duration
- Fleet utilization
- Idling
- Trip count
- Vehicle utilization
- Fleet utilization
- Devices online
- Devices offline
- Distribution of trips
- Trip duration by period
- Motion state
Configuring trips widgets
These widgets help you analyze how actively your vehicles are being used. To add these widgets:
-
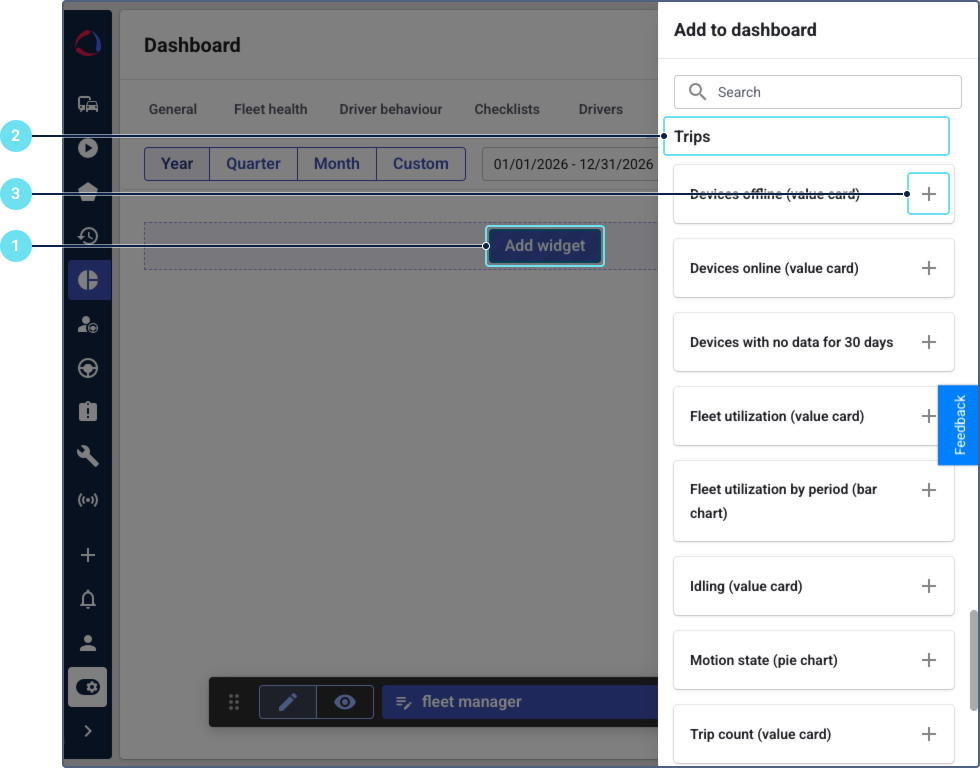
In the editor mode, click the Add widget button.
-
In the Add to dashboard panel, locate Trips.
-
Click the icon
 next to the widget name.
Devices offline (value card): This widget displays the current number of devices in your fleet that are not reporting data. Click the widget to see when each device sent its last message and how long it has been offline.
Devices online (value card): This widget displays the current number of devices in your fleet that are reporting data. Click the widget to see when each device sent its last message.
Devices with no data for 30 days (value card): This widget displays the number of devices that have not sent any data to the system for 30 days, indicating a potential issue. Click the widget to see when each device sent its last message and how long it has been offline.
Fleet utilization by period (bar chart): This chart shows the average fleet utilization percentage for specific time periods (daily, weekly, monthly). The states are categorized into Working, Idling, and Parking. Click a chart bar to view detailed utilization information about all devices. Also, you can go to the Trip and Idling reports from the chart details.
Idling (bar chart): This widget displays idling data for the fleet over the selected period. Click a chart bar to view detailed idling information for each device. Also, you can go to the Idling report from the chart details.
Motion state (pie chart): This widget shows the number of devices that are idling, moving, parked, or in an unknown state. Click a chart segment to view the list of devices in a specific state, their last message and duration of that state.
Trip count (value card): This widget displays the total number of trips made by the fleet during the selected period. Click the widget to see a list of all devices and number of their trips. You can also go to the Trip reports from the details.
Trip distribution by day and time (bubble chart): This widget shows how trips are distributed by day of the week and time of day. After disabling the editor mode, click a bubble to see the trips that fall within the selected time interval and day of week. Also, you can go to the Trip reports from the details.
Trip mileage vs. duration (scatter chart): This widget displays a scatter chart comparing trip mileage and duration. Click a data point to view the details of the corresponding trip, including the device, distance, start and end time, and duration. You can also go to the Trip reports from the details.
Vehicle utilization (list): This widget displays a list showing the percentage of time each vehicle was utilized, comparing the current period to the previous one. Click a vehicle name to view detailed information about its utilization. Also, you can go to the Trip and Idling reports from these details.
In all widget details views, you can sort the data by clicking a column header and download it in CSV format.